

An abbreviated hyperinsulinemic-euglycemic clamp results in similar myocardial glucose utilization in both diabetic and non-diabetic patients with ischemic cardiomyopathy
- PMID: 20387134
- PMCID: PMC5856237
- DOI: 10.1007/s12350-010-9228-0
An abbreviated hyperinsulinemic-euglycemic clamp results in similar myocardial glucose utilization in both diabetic and non-diabetic patients with ischemic cardiomyopathy
Abstract
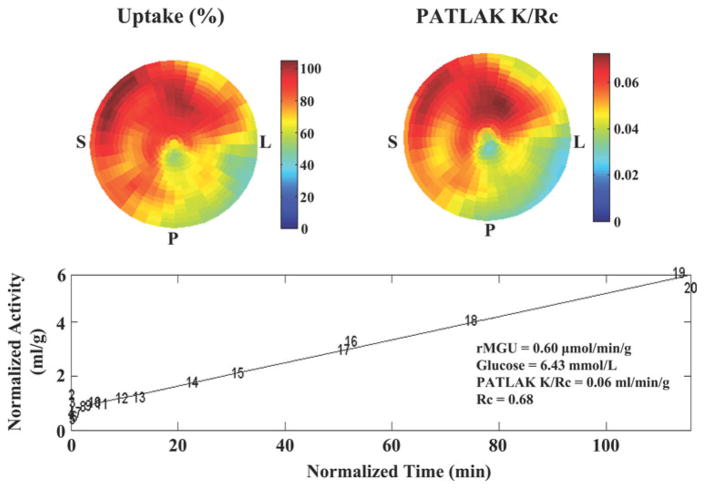
Background: Positron emission tomography (PET) with insulin-stimulated (18)F-2-deoxyglucose (FDG) uptake is the gold standard for myocardial viability. However, insulin stimulation is infrequently performed due to time and inconvenience. We therefore assessed the clinical applicability of an abbreviated hyperinsulinemic-euglycemic clamp.
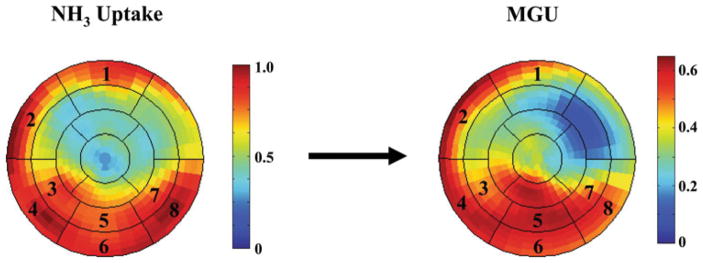
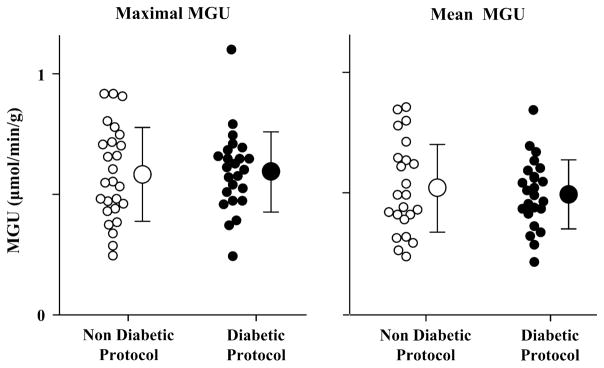
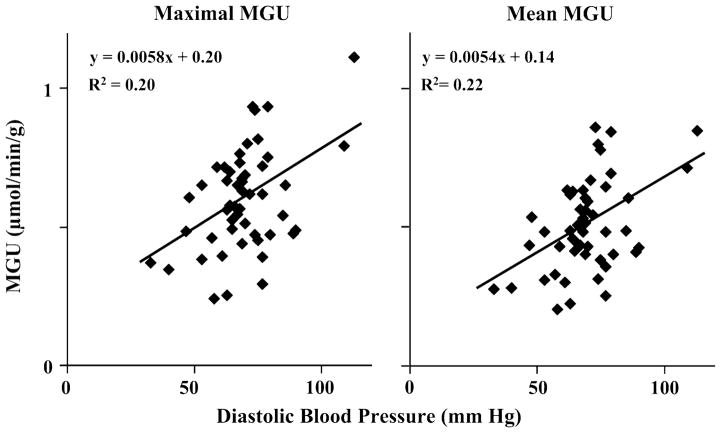
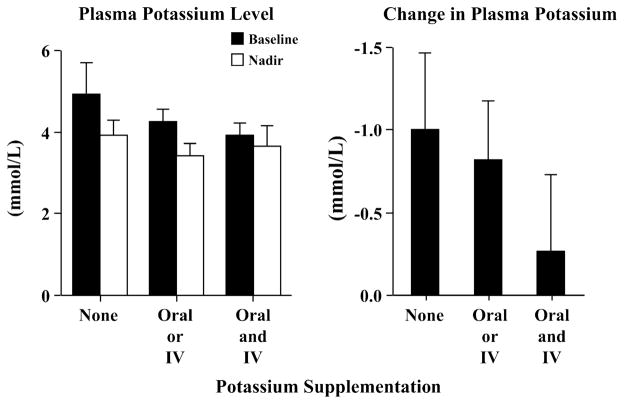
Methods and results: Dynamic FDG PET was performed in 50 patients with ischemic cardiomyopathy (ejection fraction: .30 +/- .10) using an abbreviated hyperinsulinemic-euglycemic clamp with separate Non-Diabetic (n = 26) and Diabetic (n = 24) protocols (American Society of Nuclear Cardiology guidelines), and supplemental potassium. In regions with normal resting perfusion ((13)N-ammonia uptake >or=80% maximal segment), there were no differences in either maximal (Non-Diabetic: .60 +/- .20 vs Diabetic: .60 +/- .17 micromol/min/g, P = .93) or mean rates of myocardial glucose uptake (MGU) (Non-Diabetic: .52 +/- .18 vs Diabetic: .52 +/- .14 micromol/min/g, P = .63) between the protocols. Multivariate analysis showed that diastolic blood pressure alone (maximal MGU, r (2) = .20, P = .001) or with NYHA Heart Failure Class (mean MGU, r (2) = .25, P = .003) could account for some of the variability in normal-region MGU. Potassium supplementation safely attenuated the decline in plasma levels.
Conclusions: This abbreviated hyperinsulinemic-euglycemic clamp produced similar MGU values in normal resting myocardium in non-diabetic and diabetic subjects, which are no different than published rates with a standard insulin clamp. Thus, this abbreviated approach is sufficient to overcome myocardial insulin resistance.
Figures
References
-
- Bacharach SL, Bax JJ, Case J, Delbeke D, Kurdziel KA, Martin WH, et al. PET myocardial glucose metabolism and perfusion imaging: Part 1—Guidelines for data acquisition and patient preparation. J Nucl Cardiol. 2003;10:543–56. - PubMed
-
- DeFronzo RA, Tobin JD, Andres R. Glucose clamp technique: A method for quantifying insulin secretion and resistance. Am J Physiol. 1979;237:E214–23. - PubMed
-
- Ohtake T, Yokoyama I, Watanabe T, Momose T, Serezawa T, Nishikawa J, et al. Myocardial glucose metabolism in noninsulin-dependent diabetes mellitus patients evaluated by FDG-PET. J Nucl Med. 1995;36:456–63. - PubMed
-
- Gerber BL, Vanoverschelde JL, Jr, Bol A, Michel C, Labar D, Wijns W, et al. Myocardial blood flow, glucose uptake, and recruitment of inotropic reserve in chronic left ventricular ischemic dysfunction: Implications for the pathophysiology of chronic myocardial hibernation. Circulation. 1996;94:651–9. - PubMed
-
- Marinho NVS, Keogh BE, Costa DC, Lammertsma AA, Ell PJ, Camici PG. Pathophysiology of chronic left ventricular dysfunction: New insights from the measurement of absolute myocardial blood flow and glucose utilization. Circulation. 1996;93:737–44. - PubMed
