Comparative Study
. 2010 Jul;12(7):745-55.
doi: 10.1093/neuonc/noq031. Epub 2010 Apr 13.

Oligodendroglioma cell lines containing t(1;19)(q10;p10)

Affiliations
Comparative Study

Oligodendroglioma cell lines containing t(1;19)(q10;p10)

John J P Kelly et al. Neuro Oncol. 2010 Jul.

Abstract

Investigating the biology of oligodendroglioma and its characteristic combined deletion of chromosomal arms 1p and 19q, mediated by an unbalanced translocation, t(1;19)(q10;p10), has been hampered by the lack of cell lines that harbor these traits. We grew cells from 2 anaplastic oligodendrogliomas in serum-free conditions. Serial propagation and expansion led to the establishment of permanent cell lines that maintained the genetic signature of the parent oligodendrogliomas and displayed features of brain tumor stem cells in vitro. One line was established from a treatment-naïve tumor and the other from a temozolomide resistant recurrent tumor. These lines may be important tools for understanding the biology of oligodendrogliomas and the function of their defining genetic traits.


Figures
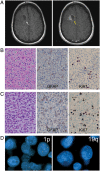
Fig. 1.
Fig. 1.
Diagnostic characteristics of an anaplastic oligodendroglioma. (A) A T1-weighted axial MR image demonstrates a large mass lesion in the right frontal lobe (white arrow) that enhances heterogeneously following administration of gadolinium (yellow arrow), leading to the presumptive diagnosis of malignant glioma. (B) Histopathologic evaluation of resected tissue from the lesion in (A) demonstrates characteristic features of oligodendroglioma including the presence of small, round cells with uniform nuclei, perinuclear halos and fine branching vasculature. This area of tumor also contains GFAP-positive neoplastic astrocytes and proliferating cells that express Ki67. (C) A second histologic pattern containing GFAP-positive mini-gemistocytes was present within the neoplasm. Ki67 immunostaining revealed a brisk mitotic rate in this area, confirming the diagnosis of anaplastic oligodendroglioma (WHO grade III). (D) FISH analysis of the primary tumor demonstrates relative loss of chromosomal arms 1p (green FISH probes in the 1p image) and 19q (red probes in the 19q image).
Fig. 2.
Fig. 2.
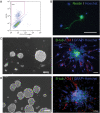
Anaplastic oligodendroglioma cells express neural stem cell markers, proliferate as multipotent spheres and self-renew. (A) A flow-cytometric dot plot demonstrates that a subpopulation of primary oligodendroglioma cells express the NSC and BTSC marker CD133. (B) A subpopulation of primary oligodendroglioma cells cultured for 7 days stain positive for nestin (nuclei were counterstained with Hoechst 33 258). (C and D) Phase-contrast photomicrographs demonstrate the typical, floating oligodendroglioma spheres, grown using the neurosphere culture system in SFM with EGF + FGF2. Primary (C) or secondary (D) oligodendroglioma spheres are multipotent and differentiate into cells that stain positive for astrocytic (GFAP), oligodendroglial (O4), and neuronal (β-III-tubulin) markers (nuclei counterstained with Hoechst 33 258). Scale bars B: 50 µm, C and D: phase contrast, 100 µm; immunofluorescence, 50 µm.
Fig. 3.
Fig. 3.
BT054, established from an anaplastic oligodendroglioma, demonstrates the codeletion of chromosomes 1p and 19q and t(1;19)(q10;p10). (A) Loss of heterozygosity analysis comparing DNA from the patient's blood, primary tumor, and the oligodendroglioma cell line demonstrates identical allelic loss for both the primary tumor and the oligodendroglioma cell line at representative loci on chromosome arms 1p and 19q. Somatic DNA isolated from blood demonstrates the normal allelic complement at representative loci on chromosomal arms 1p and 19q. (B) Array comparative genomic hybridization demonstrates that both the primary tumor and the cell line derived from it harbor relative deletions of chromosomes 1 and 19 that encompass the entire arms 1p and 19q. (C) Spectral karyotypic (SKY) analysis of a cell from the oligodendroglioma cell line demonstrates one copy of the translocation, t(1;19)(q10;p10) and loss of 1p and 19q alleles. In the SKY image, t(1;19)(q10;p10) is present adjacent to a normal chromosome 1 (yellow) and contains a long arm of chromosome 1q (yellow) together with a short chromosomal arm 19p (green). Multiple other chromosomal abnormalities are also evident in the karyotype of this cell. (D) Evaluation of the oligodendroglioma cell line using metaphase FISH. Four colored probes identify chromosome 1p (aqua), centromeric region of chromosome 1 (pink), chromosome 19q (gold), and centromeric region of chromosome 19 (green). In a single cell from BT054, this probe combination demonstrates 2 normal copies of chromosome 1, 2 copies of chromosome 19, and 2 copies of t(1;19)(q10;p10).
Fig. 3.
Fig. 3.
BT054, established from an anaplastic oligodendroglioma, demonstrates the codeletion of chromosomes 1p and 19q and t(1;19)(q10;p10). (A) Loss of heterozygosity analysis comparing DNA from the patient's blood, primary tumor, and the oligodendroglioma cell line demonstrates identical allelic loss for both the primary tumor and the oligodendroglioma cell line at representative loci on chromosome arms 1p and 19q. Somatic DNA isolated from blood demonstrates the normal allelic complement at representative loci on chromosomal arms 1p and 19q. (B) Array comparative genomic hybridization demonstrates that both the primary tumor and the cell line derived from it harbor relative deletions of chromosomes 1 and 19 that encompass the entire arms 1p and 19q. (C) Spectral karyotypic (SKY) analysis of a cell from the oligodendroglioma cell line demonstrates one copy of the translocation, t(1;19)(q10;p10) and loss of 1p and 19q alleles. In the SKY image, t(1;19)(q10;p10) is present adjacent to a normal chromosome 1 (yellow) and contains a long arm of chromosome 1q (yellow) together with a short chromosomal arm 19p (green). Multiple other chromosomal abnormalities are also evident in the karyotype of this cell. (D) Evaluation of the oligodendroglioma cell line using metaphase FISH. Four colored probes identify chromosome 1p (aqua), centromeric region of chromosome 1 (pink), chromosome 19q (gold), and centromeric region of chromosome 19 (green). In a single cell from BT054, this probe combination demonstrates 2 normal copies of chromosome 1, 2 copies of chromosome 19, and 2 copies of t(1;19)(q10;p10).
Fig. 4.
Fig. 4.
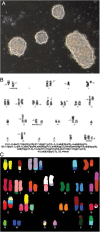
BT088, established from a recurrent anaplastic oligodendroglioma, demonstrates the codeletion of chromosomes 1p and 19q and t(1;19)(q10;p10). (A) Phase contrast photomicrographs demonstrate floating oligodendroglioma spheres that arose after culturing the primary cell suspension of BT088 using the neurosphere culture system in SFM with EGF + FGF2. (B) Karyotypic analysis of one representative cell from the oligodendroglioma cell line demonstrates one copy of the translocation, t(1;19)(q10;p10), codeletion of 1p and 19q, and many other numeric and structural abnormalities including other chromosomal translocations. (C) Spectral karyotypic (SKY) analysis of a cell from the oligodendroglioma cell line BT088 demonstrates one copy of the translocation, t(1;19)(q10;p10). In this cell, t(1;19)(q10;p10) is present adjacent to a normal chromosome 1 (yellow) and combines a long arm of chromosome 1q (yellow) with a short arm of chromosome 19 (green). Multiple other abnormalities are also evident in this cell.
Fig. 5.
Fig. 5.
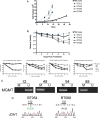
Growth and chemotherapeutic response characteristics of BT054 and BT088. (A) BT054 and BT088 proliferate and expand at a much slower rate than the GBM lines, BT012 and BT048. [n = 3 experiments per culture; data expressed as mean ± SEM] (B) BT054 viability is reduced by treatment with a clinically relevant dose of TMZ (5 µg/mL) over 12 days. BT054 is more sensitive to TMZ than BT012 but displays a response profile that is indistinguishable from BT048. BT088 and BT012 are equally resistant to TMZ. Dose–response curves after exposure to TMZ (dose range: 1–100 µg/mL) are illustrated for all lines. BT054 and BT048 displayed similar reductions in viability (ie, TMZ sensitivity) over the entire dose range, whereas BT088 and BT012 showed reduced viability only at very high doses of TMZ. [n = 3 experiments per time point per cell line; data presented as mean ± SEM] (C) BT054, BT088, and BT048 have a methylated MGMT promoter, whereas BT012 is unmethylated. (D) Nucleotide base positions numbered 625–635 from the start of the IDH1 gene, that include codon 132 of exon 4, are displayed demonstrating that BT054 harbors a somatic IDH1 mutation at codon 132 resulting in the alteration R132H. IDH1 in BT088 is wild-type.
Fig. 6.
Fig. 6.
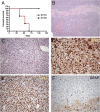
BT088 oligodendroglioma cells initiate oligodendrogliomas in immunocompromised mice. (A) A Kaplan–Meier survival curve demonstrates that animals implanted with BT088 cells have significantly shorter survival than those implanted with an identical number of BT054 cells. Animals implanted with BT054 cells did not develop tumors. (B) H&E staining demonstrates the presence of a highly cellular, infiltrating mass lesion within the brain resulting from the implantation of BT088 cells. (C) H&E staining at higher magnification demonstrates that BT088 tumors contain small, round cells with uniform nuclei and thus have the characteristic appearance of oligodendroglioma. (D) Brain tumors that formed in NOD-SCID mice following implantation of BT088 cells were highly proliferative lesions demonstrated by the high number of mitotically active cells that expressed Ki67 and as such resemble anaplastic oligodendroglioma (WHO grade III). (E and F) Expression of markers indicating oligodendroglial (Olig2) (E) differentiation was observed in tumors that grew in the brains of NOD-SCID mice following BT088 cell implantation; markers of astroglial differentiation (GFAP) were not observed in these tumors (F).

References

    1. Louis DN, Ohgaki H, Weistler OD, Cavenee WK. WHO Classification of Tumors of the Central Nervous System. 4th ed. Lyon, France: IARC; 2007.
    1. Cairncross JG, Ueki K, Zlatescu MC, et al. Specific genetic predictors of chemotherapeutic response and survival in patients with anaplastic oligodendrogliomas. J Natl Cancer Inst. 1998;90:1473–1479. - PubMed
    1. Jenkins RB, Blair H, Ballman KV, et al. A t(1;19)(q10;p10) mediates the combined deletions of 1p and 19q and predicts a better prognosis of patients with oligodendroglioma. Cancer Res. 2006;66:9852–9861. - PubMed
    1. Griffin CA, Burger P, Morsberger L, et al. Identification of der(1;19)(q10;p10) in five oligodendrogliomas suggests mechanism of concurrent 1p and 19q loss. J Neuropathol Exp Neurol. 2006;65:988–994. - PubMed
    1. Cairncross G, Berkey B, Shaw E, et al. Phase III trial of chemotherapy plus radiotherapy compared with radiotherapy alone for pure and mixed anaplastic oligodendroglioma: Intergroup Radiation Therapy Oncology Group Trial 9402. J Clin Oncol. 2006;24:2707–2714. - PubMed

Publication types

MeSH terms