. 2010 Jun 2;29(11):1803-16.
doi: 10.1038/emboj.2010.63. Epub 2010 Apr 13.

The SNAG domain of Snail1 functions as a molecular hook for recruiting lysine-specific demethylase 1

Affiliations

The SNAG domain of Snail1 functions as a molecular hook for recruiting lysine-specific demethylase 1

Yiwei Lin et al. EMBO J. .

Abstract

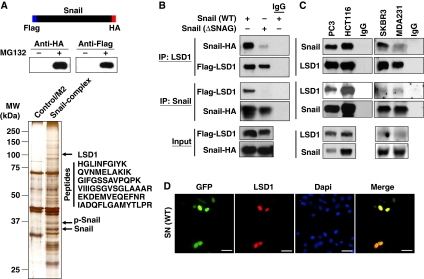
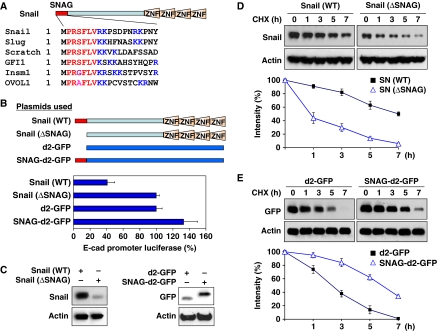
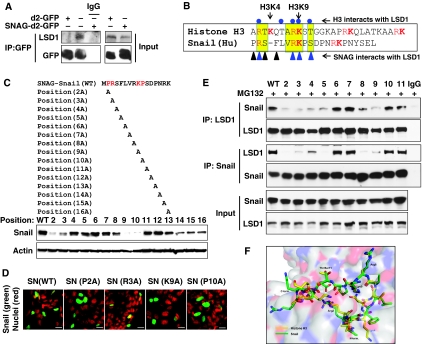
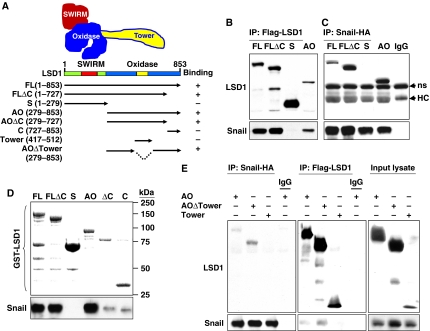
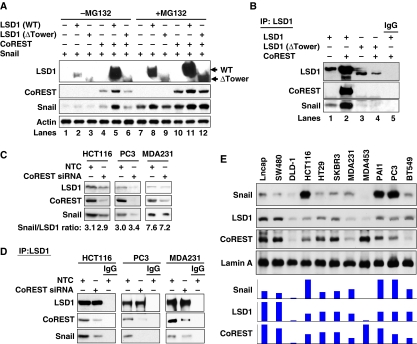
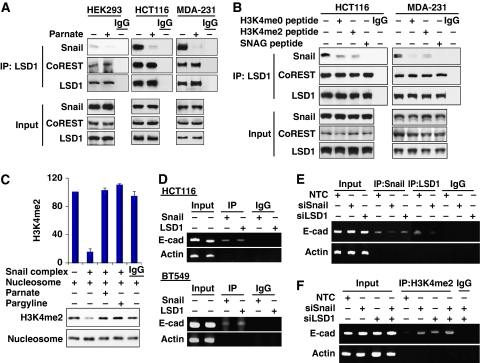
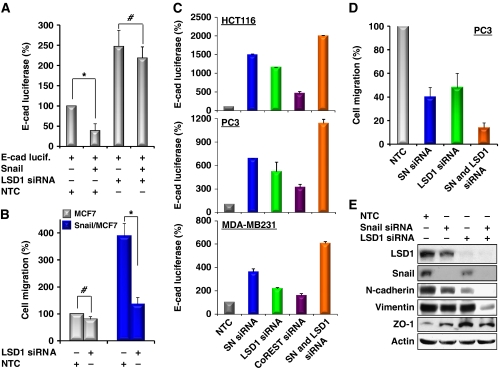
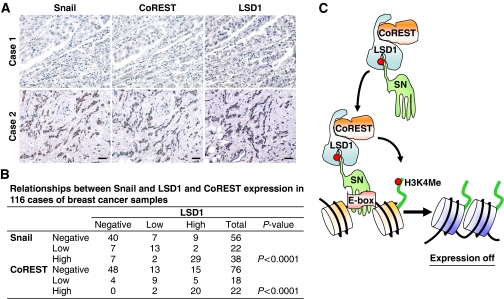
Epithelial-mesenchymal transition (EMT) is a transdifferentiation programme. The mechanism underlying the epigenetic regulation of EMT remains unclear. In this study, we identified that Snail1 interacted with histone lysine-specific demethylase 1 (LSD1). We demonstrated that the SNAG domain of Snail1 and the amine oxidase domain of LSD1 were required for their mutual interaction. Interestingly, the sequence of the SNAG domain is similar to that of the histone H3 tail, and the interaction of Snail1 with LSD1 can be blocked by LSD1 enzymatic inhibitors and a histone H3 peptide. We found that the formation of a Snail1-LSD1-CoREST ternary complex was critical for the stability and function of these proteins. The co-expression of these molecules was found in cancer cell lines and breast tumour specimens. Furthermore, we showed that the SNAG domain of Snail1 was critical for recruiting LSD1 to its target gene promoters and resulted in suppression of cell migration and invasion. Our study suggests that the SNAG domain of Snail1 resembles a histone H3-like structure and functions as a molecular hook for recruiting LSD1 to repress gene expression in metastasis.


Conflict of interest statement

The authors declare that they have no conflict of interest.

Figures

Figure 1
Figure 1
Snail1 interacts with LSD1 through the SNAG domain. (A) The schematic diagram shows the stable expression of dual-tagged Snail1 in HEK293 cells (top and middle panels). The Snail1 complex was isolated by two-step immunopurification, separated on SDS–PAGE and visualized by silver staining. A protein with molecular weight close to 110 kDa was excised and identified as LSD1 by mass spectrometry (bottom panel). (B) Flag-tagged LSD1 and HA-tagged wild-type or SNAG-deleted Snail1 were co-expressed in HEK293 cells. After immunoprecipitation, bound Snail1 or LSD1 was examined by western blotting. (C) Endogenous Snail1 and LSD1 were immunoprecipitated from PC3, HCT116, SKBR3 and MDA-MB231 cells and bound endogenous LSD1 and Snail1 were examined by western blotting. (D) GFP-tagged Snail1 was expressed in HEK293 cells. After fixation, the cellular localization of Snail1 (green) and LSD1 (red) was examined by immunofluorescent staining. Scale bar=50 μm.
Figure 2
Figure 2
The SNAG domain is essential for the stability of Snail1. (A) Sequence alignment of the SNAG domain from several transcriptional repressors. The consensus sequence is shown in red and the lysine and arginine residues are highlighted in blue. (B) Scheme showing the SNAG constructs used in this study (top panel). WT or SNAG-deleted Snail1, d2-GFP or SNAG-d2-GFP was co-expressed with the E-cadherin promoter luciferase construct in MCF7 cells. After 48 h, luciferase activity was measured by using a Dual-Luciferase Reporter Assay (Promega) (mean±s.d. of three separate experiments; bottom panel). (C) WT and SNAG-deleted Snail1, d2-GFP and SNAG–d2-GFP were expressed in HEK293 cells and analysed by western blotting. (D) WT or SNAG-deleted Snail1 was expressed in HEK293 cells then treated with cycloheximide (10 μg/ml) for different time intervals. The level of Snail1 was analysed by western blotting. Densitometry results from three independent experiments were statistically analysed and plotted (bottom panel). A representative western blotting experiment is shown in the top panel. (E) d2-GFP or SNAG-fused d2-GFP was expressed in HEK293 cells and treated with cycloheximide as described above. The level of d2-GFP was analysed by western blotting. Densitometry results from three independent experiments were statistically analysed and plotted (bottom panel) and a representative blot is shown on the top panel.
Figure 3
Figure 3
The SNAG domain of Snail1 interacts with LSD1 by mimicking the structure of the tail of histone H3. (A) d2-GFP or SNAG–d2-GFP was expressed in HEK293 cells. After immunoprecipitation of d2-GFP, bound endogenous LSD1 was examined by western blotting. (B) The schematic diagram shows the sequence alignment of the SNAG domain with the histone H3 tail. The conserved sequence is highlighted in yellow and arginine and lysine resides are shown in red. Residues of Arg2, Thr6, Arg8, Lys9 and Thr11 of histone H3 (highlighted in blue dots on the top) are important for establishing the critical interaction of histone H3 within the catalytic cavity of LSD1 (Forneris et al, 2008). Triangles at the bottom represent the residues on the SNAG domain that are important for interacting with LSD1. (C) Schematic diagram shows the position of the alanine mutations in the SNAG domain (top panel). The Snail1 mutants were expressed in HEK293 cells and the level of Snail1 was examined by western blotting (bottom panel). (D) EGFP-tagged WT or mutant Snail1 was expressed in HEK293 cells and the subcellular localization of Snail1 (green) was visualized by immunofluorescence microscopy (DAPI for nuclei, red). Scale bar=20 μm. (E) WT or mutant Snail1 was expressed in HEK293 cells treated with MG132 (10 μM) for 6 h. Endogenous LSD1, WT or Snail1 mutants were immunoprecipitated, and the bound Snail1 or endogenous LSD1 was examined by western blotting, respectively. Input lysates were shown in the bottom panel. (F) A ball-and-stick model structure of the LSD1–SNAG–Snail1 complex (green) superposed to the LSD1–histone H3 peptide complex (yellow; PDB access code 2V1d) showing the position of key interacting residues and the substrate lysine residue (Lys4). The LSD1 molecule is shown as a partially transparent surface representation.
Figure 4
Figure 4
AO domain of LSD1 is responsible for its interaction with Snail1. (A) The cartoon and schematic diagram shows the structure of LSD1 and the different deletion constructs used in this study. (B, C) HA-tagged Snail1 and Flag-tagged full-length or deletion mutants of LSD1 were co-expressed in HEK293 cells treated with MG132 for 6 h. After immunoprecipitation, bound Snail1 (B) and LSD1 (C) were examined by western blotting. (D) GST-tagged full-length or deletion mutants of LSD1 were incubated with lysate from HEK293 cells expressing Snail1. The GST pull-down complex was eluted with SDS–PAGE buffer and about one-tenth of these elutents were analysed for the association of Snail1 by western blotting (bottom panel). The rest of the elutents were examined for the presence of purified GST–LSD1 by Coomassie staining (top panel). (E) Flag-tagged AO domain, AO domain without Tower (AOΔTower) or Tower domain of LSD1 was co-expressed with Snail1 in HEK293 cells treated with MG132 for 6 h. After immunoprecipitation, the bound deletion mutants of LSD1 and Snail1 were examined by western blotting.
Figure 5
Figure 5
CoREST enhances the interaction of LSD1 with Snail1 and the stability of the ternary complex. (A) Snail1, WT or Tower-deleted LSD1, and CoREST were co-expressed in HEK293 cells. Cells were treated with or without MG132 for 6 h before being collected. The levels of LSD1, Snail1 and CoREST were analysed by western blotting. (B) WT or Tower-deleted LSD1 and CoREST were co-expressed in Snail1/HEK293 cells. After immunoprecipitation of LSD1, the bound Snail1 and CoREST were examined by western blotting. (C) CoREST siRNA or non-target control (NTC) was expressed in HCT116, PC3 and MDA-MB231 cells. Endogenous LSD1, CoREST and Snail1 were examined by western blotting. (D) Cells were prepared as described above in (C). After endogenous LSD1 was immunoprecipitated, the bound CoREST and Snail1 were examined by western blotting. (E) Nuclear extracts from various cancer cell lines were analysed for the levels of Snail1, LSD1 and CoREST by western blotting. Lamin A served as the nuclear marker. The expression intensity of these proteins was plotted and shown (bottom panel).
Figure 6
Figure 6
Interaction with Snail1 is required for LSD1 recruitment to the E-cadherin promoter in vivo. (A) The LSD1 enzymatic inhibitor Parnate (100 μM) was added to the immunoprecipitation buffer during immunoprecipitation. After endogenous LSD1 was immunoprecipitated from HEK293 (expressing exogenous Snail1), MDA-MB231 and HCT 116 cells, bound Snail1 and CoREST were detected by western blotting. (B) H3K4me0 (1–21 amino acids), H3K4me2 (1–21 amino acids) and SNAG peptides (60 μg/ml) were added to the immunoprecipitation buffer during immunoprecipitation. After endogenous LSD1 was immunoprecipitated, bound Snail1 and CoREST were detected by western blotting as described above. (C) In vitro histone demethylation assay was carried out as described in the Materials and methods section using mononucleosomes as substrate. After the reaction, demethylation of histone H3K4 was examined by western blotting. The statistical analysis for the demethylation from three independent experiments is shown on the bar graph (top panel). A representative demethylation assay is shown in the bottom panel. (D) The association of endogenous Snail1 and LSD1 with the E-cadherin promoter was analysed by chromatin immunoprecipitation (ChIP) assay in HCT116 and BT549 cells. (E) Snail1, LSD1 or non-target control (NTC) siRNA was expressed in HCT116 cells, the association of endogenous Snail1 and LSD1 with the E-cadherin promoter was analysed by ChIP assay. (F) Snail1, LSD1 or non-target control siRNA was expressed in HCT116 cells; methylation of H3K4 on the E-cadherin promoter was analysed by CHIP assay using anti-H3K4me2 antibody.
Figure 7
Figure 7
Knockdown of Snail1 and LSD1 expression suppresses cell migration. (A) An E-cadherin promoter luciferase construct was co-expressed with or without Snail1, non-target control (NTC) or LSD1 siRNA in MCF7 cells. After 48 h, luciferase activities were normalized and determined (mean±s.d. of three separate experiments). Luciferase activities for each sample were statistically analysed by Student's t-test (P<0.01). *P<0.001; #, no significance. (B) LSD1 or NTC siRNA was expressed in isogenic MCF7 and Snail1/MCF7 cells. After 48 h, a scratch (‘wound') was induced in a cell monolayer and cell culture was continued for an additional 48 h. Images were obtained at the beginning and at the 48 h time point to monitor the cell migration for the closure of the wound. The percentage of cell migration was calculated on the basis of the migration of MCF7 cells (experiments were conducted at least twice in duplicate). Statistical analysis was performed by Student's t test (P<0.01). *P<0.001; #, no significance. (C) Snail1 (SN), LSD1, CoREST and NTC siRNA were co-expressed with the E-cadherin promoter luciferase construct in HCT116, PC3 and MDA-MB231 cells. After 48 h, luciferase activities were normalized and determined (mean±s.d. of three separate experiments). (D) Snail1 (SN), LSD1 and NTC siRNA were expressed in HCT116, PC3 and MDA-MB231 cells as described in (C). After 48 h, a scratch (‘wound') was induced in a cell monolayer and cell culture was continued for 48 h to measure cell migration as described in (B). The statistical analysis for the migration of PC3 cells is shown on the bar graph, whereas statistical results for HCT116 and MDA-MB231 cells are shown in Supplementary Figure S12A. Representative images from PC3 cells are shown in Supplementary Figure S12B. (E) PC3 cells were treated as described above and expressions of LSD1, Snail1, N-cadherin, vimentin, ZO-1 and Actin were examined by western blotting.
Figure 8
Figure 8
Expression of Snail1 correlates with the level of LSD1 and CoREST in tumour tissues. (A) The 116 surgical specimens of breast cancer were immunostained using antibodies against Snail1, LSD1, CoREST, and the control serum (data not shown). Representative stainings from the same tumour samples are shown. Scale bar=100 μm. (B) The expression patterns of Snail1, LSD1 and CoREST in the 116 breast tumour samples were determined and summarized. Correlation of Snail1 with LSD1 and CoREST was analysed using Fisher's exact test (P<0.001). P<0.05 was set as the criterion for statistical significance. (C) A proposed model to illustrate how Snail1 recruits the LSD1–CoREST complex to the E-cadherin promoter. The SNAG domain of Snail1 assembles a histone H3-like structure and serves as a molecular ‘hook' (or pseudo-substrate, a red dot indicates the critical residues in Snail1 and histone H3 that interact with LSD1) to interact with the LSD1–CoREST complex. The formation of this complex stabilizes the individual components from potential proteasomal degradation. Snail1 brings this complex to its targeted gene promoters through the binding of the E-box through the zinc-finger motifs. An overabundant amount of histone H3 at the chromatin region outcompetes the binding of the SNAG domain with the catalytic core of LSD1 and results in the demethylation of histone H3K4.

Comment in

References

    1. Barrallo-Gimeno A, Nieto MA (2009) Evolutionary history of the Snail/Scratch superfamily. Trends Genet 25: 248–252 - PubMed
    1. Batlle E, Sancho E, Franci C, Dominguez D, Monfar M, Baulida J, Garcia De Herreros A (2000) The transcription factor snail is a repressor of E-cadherin gene expression in epithelial tumour cells. Nat Cell Biol 2: 84–89 - PubMed
    1. Berger SL (2007) The complex language of chromatin regulation during transcription. Nature 447: 407–412 - PubMed
    1. Bernstein BE, Meissner A, Lander ES (2007) The mammalian epigenome. Cell 128: 669–681 - PubMed
    1. Bhaumik SR, Smith E, Shilatifard A (2007) Covalent modifications of histones during development and disease pathogenesis. Nat Struct Mol Biol 14: 1008–1016 - PubMed

Publication types