

Evidence for a relationship between body mass and energy metabolism in the human brain
- PMID: 20389303
- PMCID: PMC2949217
- DOI: 10.1038/jcbfm.2010.48
Evidence for a relationship between body mass and energy metabolism in the human brain
Abstract
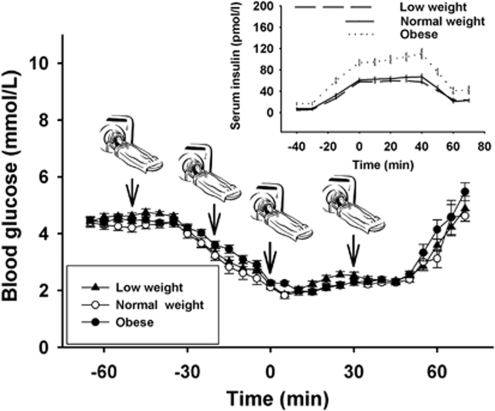
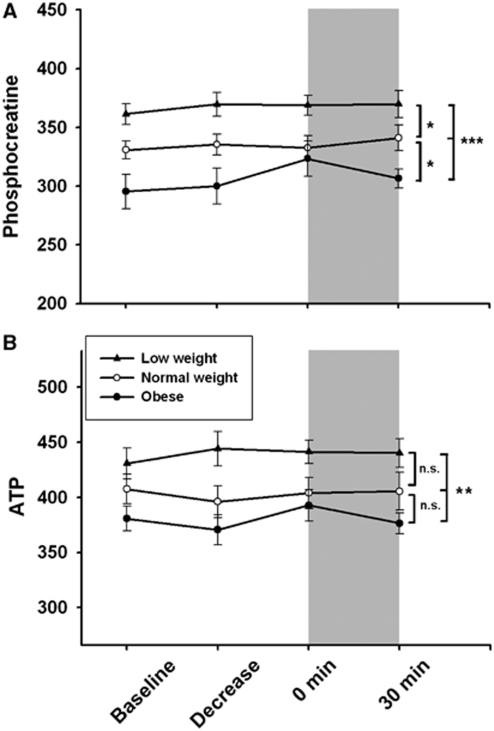
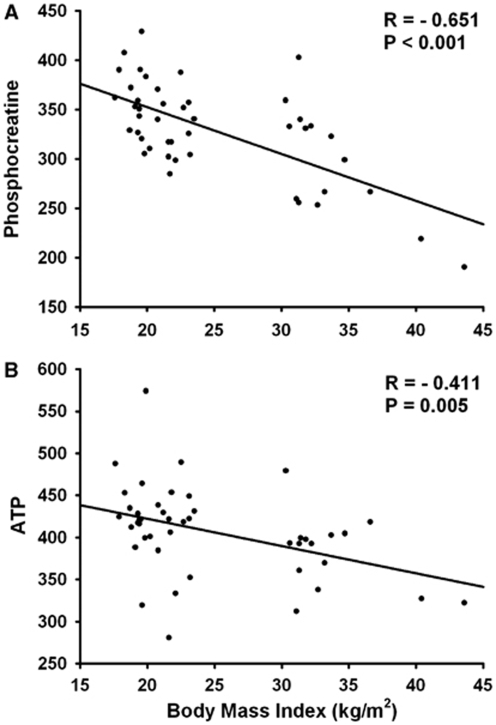
Cerebral energy metabolism has been suggested to have an important function in body weight regulation. We therefore examined whether there is a relationship between body mass and adenosine triphosphate (ATP) metabolism in the human brain. On the basis of our earlier findings indicating a neuroprotective preferential energy supply of the brain, as compared with peripheral muscle on experimentally induced hypoglycemia, we examined whether this physiological response is preserved also in low-weight and obese participants. We included 45 healthy male subjects with a body mass index (BMI) ranging from 17 to 44 kg/m(2). Each participant underwent a hypoglycemic glucose-clamp intervention, and the ATP metabolism, that is, the content of high-energy phosphates phosphocreatine (PCr) and ATP, was measured repeatedly by (31)phosphor magnetic resonance spectroscopy ((31)P-MRS) in the cerebral cortex and skeletal muscle. Results show an inverse correlation between BMI and high-energy phosphate content in the brain (P<0.01), whereas there was no such relationship found between skeletal muscle and BMI. The hypoglycemic clamp intervention did not affect the ATP metabolism in both tissues. Our data show an inverse correlation between BMI and cerebral high-energy phosphate content in healthy humans, suggesting a close relationship between energetic supply of the brain and body weight regulation.
Figures
Similar articles
-
Differential energetic response of brain vs. skeletal muscle upon glycemic variations in healthy humans.Am J Physiol Regul Integr Comp Physiol. 2008 Jan;294(1):R12-6. doi: 10.1152/ajpregu.00093.2007. Epub 2007 Oct 31. Am J Physiol Regul Integr Comp Physiol. 2008. PMID: 17977922
-
Lactate infusion increases brain energy content during euglycemia but not hypoglycemia in healthy men.NMR Biomed. 2019 Nov;32(11):e4167. doi: 10.1002/nbm.4167. Epub 2019 Aug 29. NMR Biomed. 2019. PMID: 31468650 Clinical Trial.
-
Memantine prevents hypoglycemia-induced decrements of the cerebral energy status in healthy subjects.J Clin Endocrinol Metab. 2011 Feb;96(2):E384-8. doi: 10.1210/jc.2010-1348. Epub 2010 Nov 24. J Clin Endocrinol Metab. 2011. PMID: 21106713 Clinical Trial.
-
High-energy phosphate metabolism in the exercising muscle of patients with peripheral arterial disease.Vasa. 2008 Aug;37(3):199-210. doi: 10.1024/0301-1526.37.3.199. Vasa. 2008. PMID: 18690587 Review.
-
Quantitative imaging of brain energy metabolisms and neuroenergetics using in vivo X-nuclear 2H, 17O and 31P MRS at ultra-high field.J Magn Reson. 2018 Jul;292:155-170. doi: 10.1016/j.jmr.2018.05.005. J Magn Reson. 2018. PMID: 29866434 Free PMC article. Review.
Cited by
-
Mobile Phone Radiation Deflects Brain Energy Homeostasis and Prompts Human Food Ingestion.Nutrients. 2022 Jan 14;14(2):339. doi: 10.3390/nu14020339. Nutrients. 2022. PMID: 35057520 Free PMC article. Clinical Trial.
-
Age-related changes in energy metabolism in peripheral mononuclear blood cells (PBMCs) and the brains of cognitively healthy seniors.Geroscience. 2024 Feb;46(1):981-998. doi: 10.1007/s11357-023-00810-9. Epub 2023 Jun 13. Geroscience. 2024. PMID: 37308768 Free PMC article.
-
Intranasal insulin suppresses food intake via enhancement of brain energy levels in humans.Diabetes. 2012 Sep;61(9):2261-8. doi: 10.2337/db12-0025. Epub 2012 May 14. Diabetes. 2012. PMID: 22586589 Free PMC article. Clinical Trial.
-
Blueberry Supplementation in Midlife for Dementia Risk Reduction.Nutrients. 2022 Apr 13;14(8):1619. doi: 10.3390/nu14081619. Nutrients. 2022. PMID: 35458181 Free PMC article. Clinical Trial.
-
Nutritional ketosis for mild cognitive impairment in Parkinson's disease: A controlled pilot trial.Clin Park Relat Disord. 2019 Aug 6;1:41-47. doi: 10.1016/j.prdoa.2019.07.006. eCollection 2019. Clin Park Relat Disord. 2019. PMID: 34316598 Free PMC article.
References
-
- Bachert-Baumann P, Ermark F, Zabel HJ, Sauter R, Semmler W, Lorenz WJ. In vivo nuclear Overhauser effect in 31P-(1H) double-resonance experiments in a 1.5-T whole-body MR system. Magn Reson Med. 1990;15:165–172. - PubMed
-
- Barker PB, Butterworth EJ, Boska MD, Nelson J, Welch KM. Magnesium and pH imaging of the human brain at 3.0 Tesla. Magn Reson Med. 1999;41:400–406. - PubMed
-
- Barker PB, Golay X, Artemov D, Ouwerkerk R, Smith MA, Shaka AJ. Broadband proton decoupling for in vivo brain spectroscopy in humans. Magn Reson Med. 2001;45:226–232. - PubMed
-
- Bischof MG, Mlynarik V, Brehm A, Bernroider E, Krssak M, Bauer E, Madl C, Bayerle-Eder M, Waldhausl W, Roden M. Brain energy metabolism during hypoglycaemia in healthy and type 1 diabetic subjects. Diabetologia. 2004;47:648–651. - PubMed
-
- Bruning JC, Gautam D, Burks DJ, Gillette J, Schubert M, Orban PC, Klein R, Krone W, Muller-Wieland D, Kahn CR. Role of brain insulin receptor in control of body-weight and reproduction. Science. 2000;289:2122–2125. - PubMed
MeSH terms
Substances
LinkOut - more resources
Full Text Sources
