

Metal-Containing Polystyrene Beads as Standards for Mass Cytometry
- PMID: 20390041
- PMCID: PMC2852877
- DOI: 10.1039/b921770c
Metal-Containing Polystyrene Beads as Standards for Mass Cytometry
Abstract
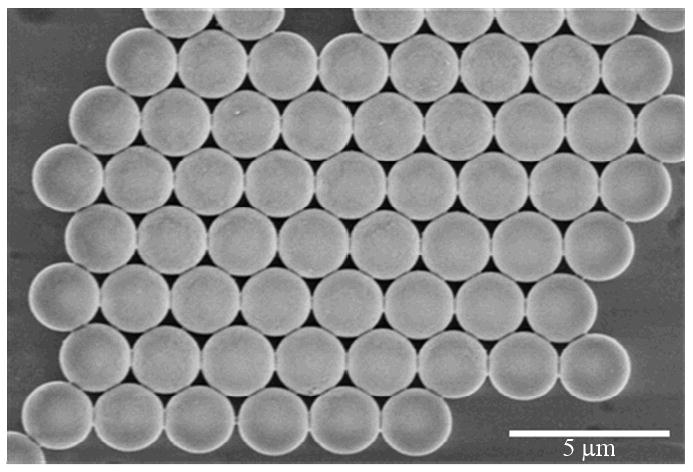
We examine the suitability of metal-containing polystyrene beads for the calibration of a mass cytometer instrument, a single particle analyser based on an inductively coupled plasma ion source and a time of flight mass spectrometer. These metal-containing beads are also verified for their use as internal standards for this instrument. These beads were synthesized by multiple-stage dispersion polymerization with acrylic acid as a comonomer. Acrylic acid acts as a ligand to anchor the metal ions within the interior of the beads. Mass cytometry enabled the bead-by-bead measurement of the metal-content and determination of the metal-content distribution. Beads synthesized by dispersion polymerization that involved three stages were shown to have narrower bead-to-bead variation in their lanthanide content than beads synthesized by 2-stage dispersion polymerization. The beads exhibited insignificant release of their lanthanide content to aqueous solutions of different pHs over a period of six months. When mixed with KG1a or U937 cell lines, metal-containing polymer beads were shown not to affect the mass cytometry response to the metal content of element-tagged antibodies specifically attached to these cells.
Figures


Similar articles
-
Erratum: Preparation of Poly(pentafluorophenyl acrylate) Functionalized SiO2 Beads for Protein Purification.J Vis Exp. 2019 Apr 30;(146). doi: 10.3791/6328. J Vis Exp. 2019. PMID: 31038480
-
Lanthanide-containing polymer microspheres by multiple-stage dispersion polymerization for highly multiplexed bioassays.J Am Chem Soc. 2009 Oct 28;131(42):15276-83. doi: 10.1021/ja9052009. J Am Chem Soc. 2009. PMID: 19807075 Free PMC article.
-
Quantitative determination of single-bead metal content from a peptide combinatorial library.J Comb Chem. 2006 Nov-Dec;8(6):929-34. doi: 10.1021/cc060100m. J Comb Chem. 2006. PMID: 17096583
-
Metal-Encoded Polystyrene Microbeads as a Mass Cytometry Calibration/Normalization Standard Covering Channels from Yttrium (89 amu) to Bismuth (209 amu).Anal Chem. 2020 Jan 7;92(1):999-1006. doi: 10.1021/acs.analchem.9b03935. Epub 2019 Dec 9. Anal Chem. 2020. PMID: 31815445
-
Bio-Functional, Lanthanide-Labeled Polymer Particles by Seeded Emulsion Polymerization and their Characterization by Novel ICP-MS Detection.J Anal At Spectrom. 2010;25(3):269-281. doi: 10.1039/b916850h. J Anal At Spectrom. 2010. PMID: 20396648 Free PMC article.
Cited by
-
Normalization of mass cytometry data with bead standards.Cytometry A. 2013 May;83(5):483-94. doi: 10.1002/cyto.a.22271. Epub 2013 Mar 19. Cytometry A. 2013. PMID: 23512433 Free PMC article.
-
High-throughput multiplexed serology via the mass-spectrometric analysis of isotopically barcoded beads.Nat Biomed Eng. 2025 Jul;9(7):1117-1128. doi: 10.1038/s41551-025-01349-0. Epub 2025 Feb 12. Nat Biomed Eng. 2025. PMID: 39939547 Free PMC article.
-
Establishing CD19 B-cell reference control materials for comparable and quantitative cytometric expression analysis.PLoS One. 2021 Mar 19;16(3):e0248118. doi: 10.1371/journal.pone.0248118. eCollection 2021. PLoS One. 2021. PMID: 33740004 Free PMC article.
-
Exploring Sensitive Label-Free Multiplex Analysis with Raman-Coded Microbeads and SERS-Coded Reporters.Biosensors (Basel). 2022 Feb 16;12(2):121. doi: 10.3390/bios12020121. Biosensors (Basel). 2022. PMID: 35200381 Free PMC article.
-
Surface Functionalization Methods to Enhance Bioconjugation in Metal-Labeled Polystyrene Particles.Macromolecules. 2011 Jun 28;44(12):4801-4813. doi: 10.1021/ma200582q. Macromolecules. 2011. PMID: 21799543 Free PMC article.
References
-
- Baumgarth N, Roederer M. J Immunol Methods. 2000;243:77–97. - PubMed
-
- Belov L, De la Vega O, Dos Remedios CG, Mulligan SP, Christopherson RI. Cancer Res. 2001;61:4483–4489. - PubMed
-
- Borowitz MJ, Guenther KL, Shults KE, Stelzer GT. American Journal of Clinical Pathology. 1993;100:534–540. - PubMed
-
- Chattopadhyay PK, Price DA, Harper TF, Betts MR, Yu J, Gostick E, Perfetto SP, Goepfert P, Koup RA, De Rosa SC, Bruchez MP, Roederer M. Nature Medicine. 2006;12:972–977. - PubMed
Grants and funding
LinkOut - more resources
Full Text Sources
Other Literature Sources