

Review
doi: 10.1007/s00234-010-0674-9.
Patterns of neonatal hypoxic-ischaemic brain injury
Affiliations
- PMID: 20390260
- PMCID: PMC2872019
- DOI: 10.1007/s00234-010-0674-9
Item in Clipboard
Review
Patterns of neonatal hypoxic-ischaemic brain injury
Neuroradiology.
2010 Jun.
Abstract
Enormous progress has been made in assessing the neonatal brain, using magnetic resonance imaging (MRI). In this review, we will describe the use of MRI and proton magnetic resonance spectroscopy in detecting different patterns of brain injury in (full-term) human neonates following hypoxic-ischaemic brain injury and indicate the relevance of these findings in predicting neurodevelopmental outcome.
Figures
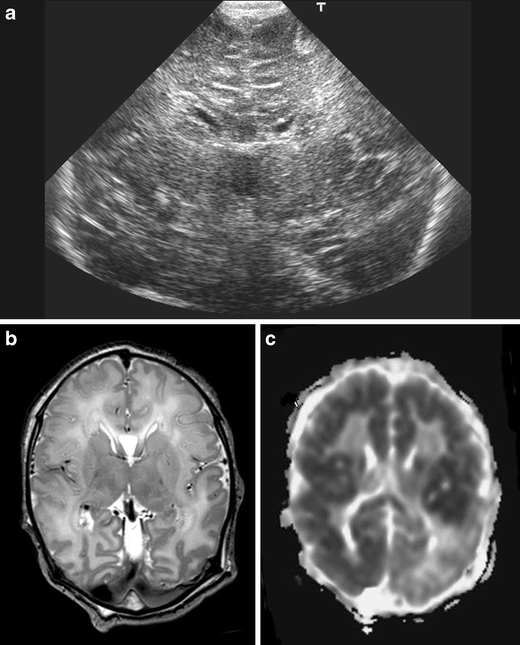
Cranial ultrasound, coronal view, day 1, showing severe echogenicity in the white matter. MRI (T2SE (TR 6284/TE 120) and ADC) performed on day 3 showing increased signal intensity in the white matter on T2SE and low signal intensity in the deep white matter on the ADC map with sparing of the anterior periventricular white matter and asymmetrical distribution in the parieto-occipital white matter. The child died and was subsequently diagnosed to have molybdenum cofactor deficiency
Full-term infant with acute sentinel event (ruptured uterus) with MRI pattern suggestive of acute near total asphyxia. a Inversion recovery sequence (TR 5038/TE 30/TI 600) does not show a normal signal within the posterior limb of the internal capsule, but areas of increased signal intensity within thalami and basal ganglia. DWI (b–d) shows restricted diffusion in the ventrolateral thalami, lentiform nuclei, cerebral peduncles, and in the perirolandic cortex. Also note involvement of the hippocampi
Full-term infant with watershed pattern of injury. Born with severe anaemia (Hb 2.2 mmol/l) following fetomaternal transfusion and a short period of hypoglycaemia (<1.1 mmol/l). Loss of cortical ribbon is noted on the T2SE (TR 6284/TE 120; a), and the corpus callosum appears to be swollen with increased signal intensity. b) The ADC map shows low-signal intensity in the posterior watershed areas, as well as the splenium of the corpus callosum and the optic radiation
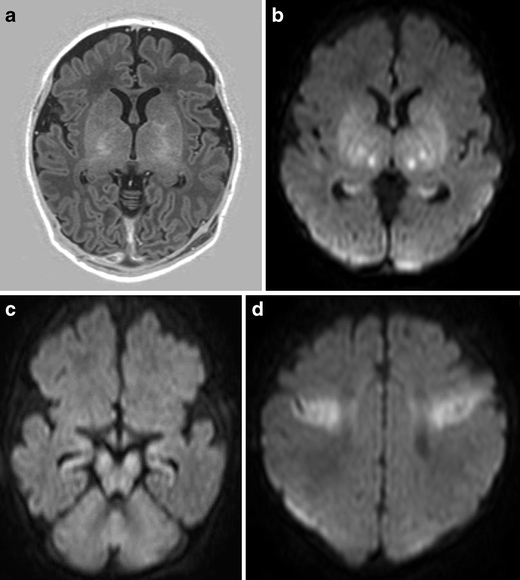
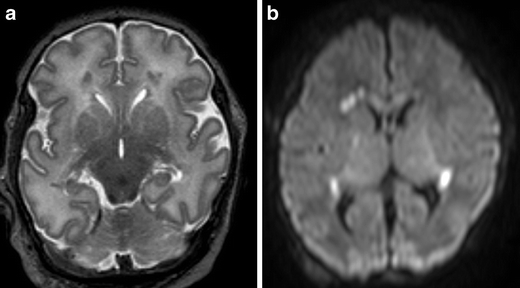
Full-term infant with ‘white brain’ pattern of injury. a, c T2SE (TR 6284/TE 120) shows increased signal intensity in the white matter with loss of cortical ribbon. There is relative sparing of the basal ganglia and immediate periventricular white matter. DWI (b, d) confirms the abnormalities and shows a striking discrepancy in signal intensity with the cerebellum. Note high-signal intensity of the mesencephalon (c) on T2SE and symmetrical restricted diffusion in the cerebral peduncles and also in the cerebellum (d)
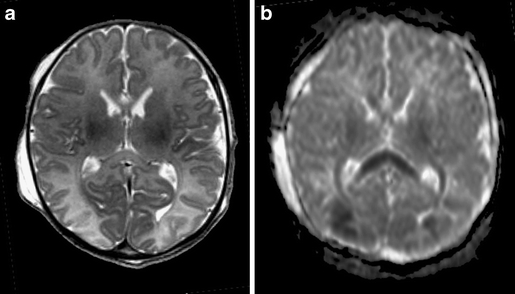
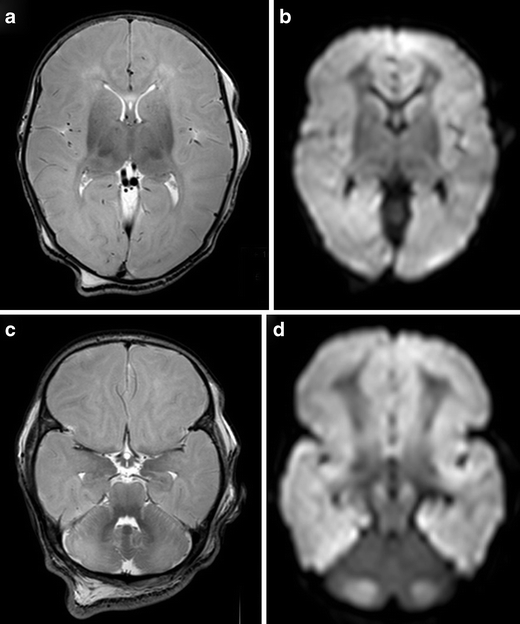
Full-term infant with punctate white matter lesions seen as low signal intensity changes on T2SE (TR 6284/TE 120) and as areas of restricted diffusion on DWI. There is also mild involvement of the corpus callosum and PLIC, seen on DWI
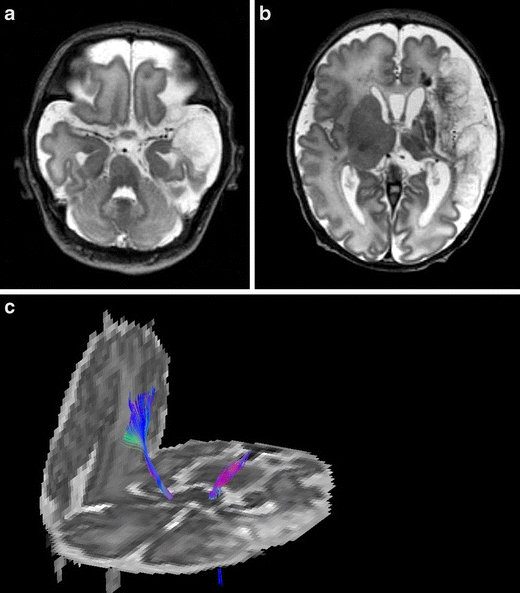
Born at 37 weeks, following antenatal diagnosis of foetal supraventricular tachycardia. MRI, T2SE (TR 6284/TE 120) performed on day 3, shows a large left-sided middle cerebral artery infarct of antenatal onset, with evidence of Wallerian degeneration and presence of cysts within the area of infarction. Diffusion tensor tractography shows loss of fibres with the corticospinal tract of the affected hemisphere
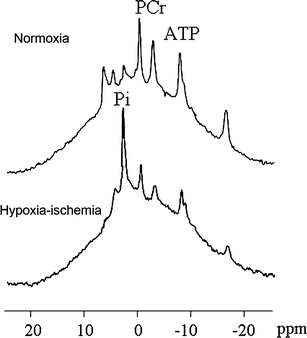
31P-MRS of a newborn piglet at baseline (top) and after 1 h of cerebral hypoxia–ischaemia (bottom). The PCr/Pi ratio and ATP peaks decreased, whereas the distance between PCr and Pi decreased, indicating a decrease in the intracellular pH [14]
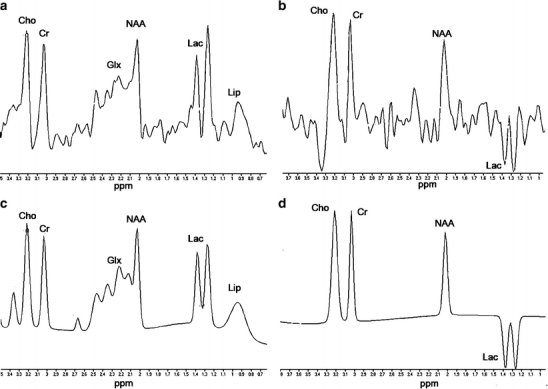
1H-MRS of a full-term neonate, 4 days after perinatal asphyxia. NAA/Cho is still within the normal range for full-term neonates, but a very large lactate resonance can be identified at1.33 ppm. a Original spectrum of TE 35 ms, b original spectrum of TE 144 ms, c fitted spectrum of TE 35 ms, and d fitted spectrum of TE 144 ms
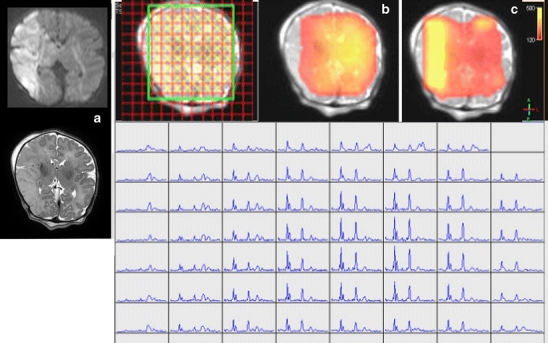
Chemical shift imaging a neonate with a large stroke in the territory of the right middle cerebral artery (a). In the infarcted area, NAA concentration is decreased (b, red), whereas Lac/NAA ratio is increased (c, yellow)
References
-
- Myers RE. Two patterns of perinatal brain damage and their conditions of occurrence. Am J Obstet Gynecol. 1997;112:246–276. - PubMed
Publication types
MeSH terms
LinkOut - more resources
Full Text Sources
Medical
