Review
. 2010 May;30(3):364-72.
doi: 10.1007/s10875-010-9393-6.

The immunological synapse: a dynamic platform for local signaling

Affiliations
Review

The immunological synapse: a dynamic platform for local signaling

Matthew F Krummel et al. J Clin Immunol. 2010 May.

Abstract

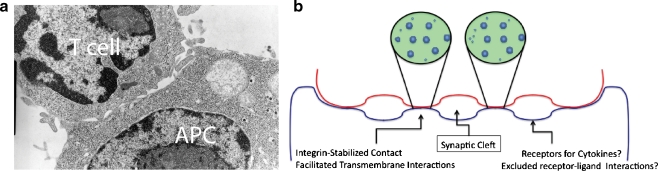
The immunological synapse (IS) as a concept has evolved from a static view of the junction between T cells and their antigen-presenting cell partners. The entire process of IS formation and extinction is now known to entail a dynamic reorganization of membrane domains and proteins within and adjacent to those domains.

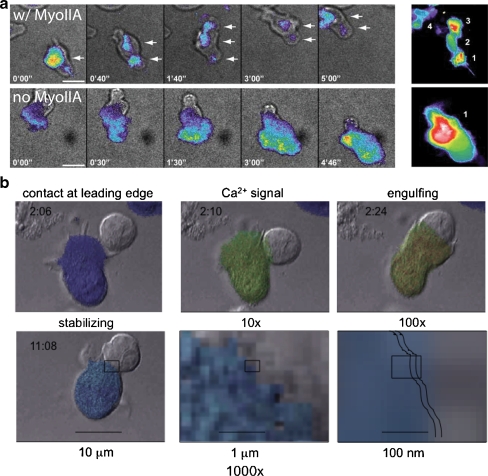
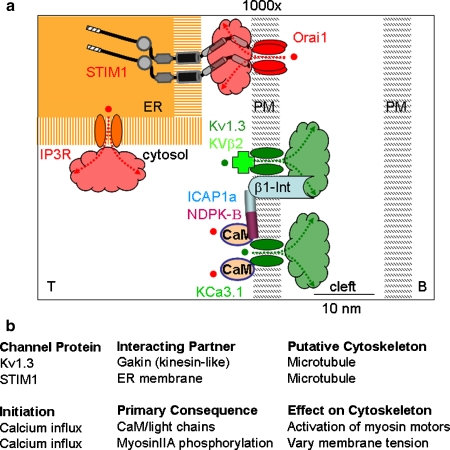
Discussion: The entire process is also intricately tied to the motility machinery-both as that machinery directs "scanning" prior to T-cell receptor engagement and as it is appropriated during the ongoing developments at the IS. While the synapse often remains dynamic in order to encourage surveillance of new antigen-presenting surfaces, cytoskeletal forces also regulate the development of signals, likely including the assembly of ion channels. In both neuronal and immunological synapses, localized Ca2+ signals and accumulation or depletion of ions in microdomains accompany the concentration of signaling molecules in the synapse. Such spatiotemporal signaling in the synapse greatly accelerates kinetics and provides essential checkpoints to validate effective cell-cell communication.


Figures

Fig. 1
Fig. 1
Multifocal and uniform models of IS assembly. a TEM of D10 CD4+ T cell interacting with CH27 APC in the presence of 1 μM antigenic peptide, 15 min after the onset of coupling. Note relative paucity of contact area compared to synaptic regions. b Models for synaptic membrane configurations in cell–cell synapse and T-cell–bilayer synapse models. In this model, each contact region may be thought of as a microcosm of a bilayer contact in which microclusters of TCRs move and coalesce in a membrane patch (expanded views)
Fig. 2
Fig. 2
Motility modes for T cells and control of membrane–membrane contacts and control by calcium signaling. a Two modes of cell–substrate interaction during motility as observed in Jacobelli et al. 2009. Individual timepoints of contacts of actin–GFP bearing cells as visualized in TIRF, to visualize the contact surface, are shown. The right-hand panel is a time-sum of all the positions that the cell made with the surface during the entire time sequence. In the top (“w/ MyoIIA”): In a “walking” mode that gives rise to faster motility rates, T cells make multiple, sequential, and discrete contacts with the substrate. Bottom (“no MyoIIA”): In a “sliding” mode more akin to how mesenchymal cells move, cells make a continuous and large contact with the substrate, gliding along during propagation. b Formation of an immunological synapse. T-cell (fura-2 dye-loaded) and B-cell images from Negulescu et al. [26]. Colors indicate T-cell cytosolic Ca2+ (dark blue ∼50 nM to red >1 μM); times shown in each frame are minute:second. Contact is initiated by the leading edge of the T cell. The leading edge probes the APC for 20 s to several minutes before the contact area expands. Ca2+ signaling begins 10 s later. The Ca2+ signal can be oscillatory, transient, or sustained, as Ca2+ enters through CRAC channel Orai1 pore-forming subunits. The signal is sustained by K+ channel (Kv1.3 or KCa3.1) activity. Ca2+ must remain elevated for synapse stabilization, inhibition of motility, and NF-AT gene expression responses. Scale bars and boxes in lower panels indicate “zooming” into the synaptic region after initial stabilization of the synapse. Jagged lines indicate the approximate width of the synaptic cleft
Fig. 3
Fig. 3
Calcium channels and the cytoskeleton at the immunological synapse. a Zoomed-in schematic diagram of region shown by box in the lower right panel of Fig. 2a, showing T-cell molecules concentrated at the synapse, separated by a narrow synaptic cleft (∼15–20 nm) from the B cell. Scales are approximate. A STIM1 dimer within the endoplasmic reticulum (ER) is shown activating a tetramer of Orai1 in the plasma membrane by direct contact. Protein domains of STIM1 include (from left to right): signal peptide, EF hand (without bound Ca2+), and SAM domains in the ER lumen; a transmembrane segment, and bipartite coiled-coil in cytosol. Depletion of the ER Ca2+ store by release of Ca2+ ions (red) through the IP3 receptor (IP 3 R) initiates signaling via STIM1 to the PM. Ca2+ first unbinds from the EF hand; STIM1 then forms oligomers that translocate to ER–PM junctions; Orai1 tetramers then open; Ca2+ ions enter the cell and begin to diffuse. Ca2+ opens KCa3.1/CaM; membrane depolarization opens Kv1.3. K+ ions (green), leaves the cytosol, and enters the cleft. Kv1.3 and KCa3.1 are linked through associated subunits to enzymes, to β1-integrin (β1-Int), and to cytoskeletal elements. Clouds indicate diffusion of Ca2+ and K+ ions and accumulation in nanodomains near Orai1 (red) and Kv1.3 and KCa3.1 channels (green). b Putative interplay between channels and the cytoskeleton. Channels themselves are likely assembled as a function of dynamic reorganization of cytoskeletal elements. Conversely, calcium transients and gradients almost certainly integrate at multiple levels to continue to stabilize or destabilize motility modes

References

    1. Monks CR, Freiberg BA, Kupfer H, Sciaky N, Kupfer A. Three-dimensional segregation of supramolecular activation clusters in T cells. Nature. 1998;395:82–6. doi: 10.1038/25764. - DOI - PubMed
    1. Trautmann A, Valitutti S. The diversity of immunological synapses. Curr Opin Immunol. 2003;15:249–54. doi: 10.1016/S0952-7915(03)00040-2. - DOI - PubMed
    1. Gunzer M, Schafer A, Borgmann S, Grabbe S, Zanker KS, et al. Antigen presentation in extracellular matrix: interactions of T cells with dendritic cells are dynamic, short lived, and sequential. Immunity. 2000;13:323–32. doi: 10.1016/S1074-7613(00)00032-7. - DOI - PubMed
    1. Huppa JB, Axmann M, Mortelmaier MA, Lillemeier BF, Newell EW, et al. TCR–peptide–MHC interactions in situ show accelerated kinetics and increased affinity. Nature. 2010;463:963–7. doi: 10.1038/nature08746. - DOI - PMC - PubMed
    1. Stinchcombe JC, Bossi G, Booth S, Griffiths GM. The immunological synapse of CTL contains a secretory domain and membrane bridges. Immunity. 2001;15:751–61. doi: 10.1016/S1074-7613(01)00234-5. - DOI - PubMed

Publication types