. 2010 Aug;59(8):1259-72.
doi: 10.1007/s00262-010-0852-y.

Promoting effect of Antrodia camphorata as an immunomodulating adjuvant on the antitumor efficacy of HER-2/neu DNA vaccine

Affiliations

Promoting effect of Antrodia camphorata as an immunomodulating adjuvant on the antitumor efficacy of HER-2/neu DNA vaccine

Chia-Hsin Huang et al. Cancer Immunol Immunother. 2010 Aug.

Abstract

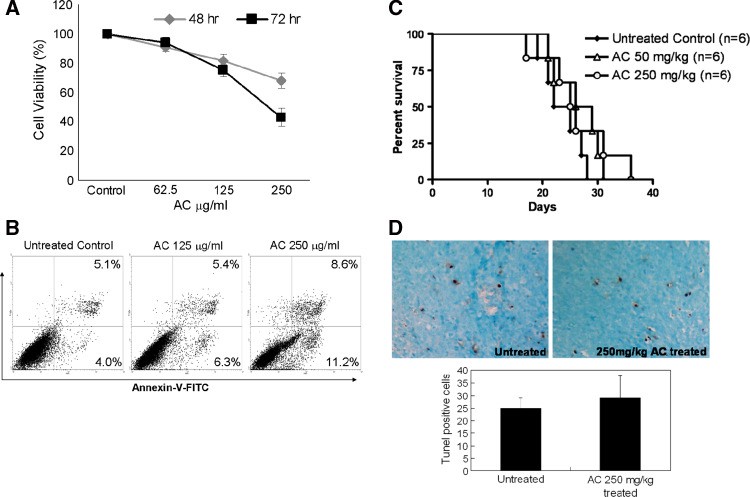
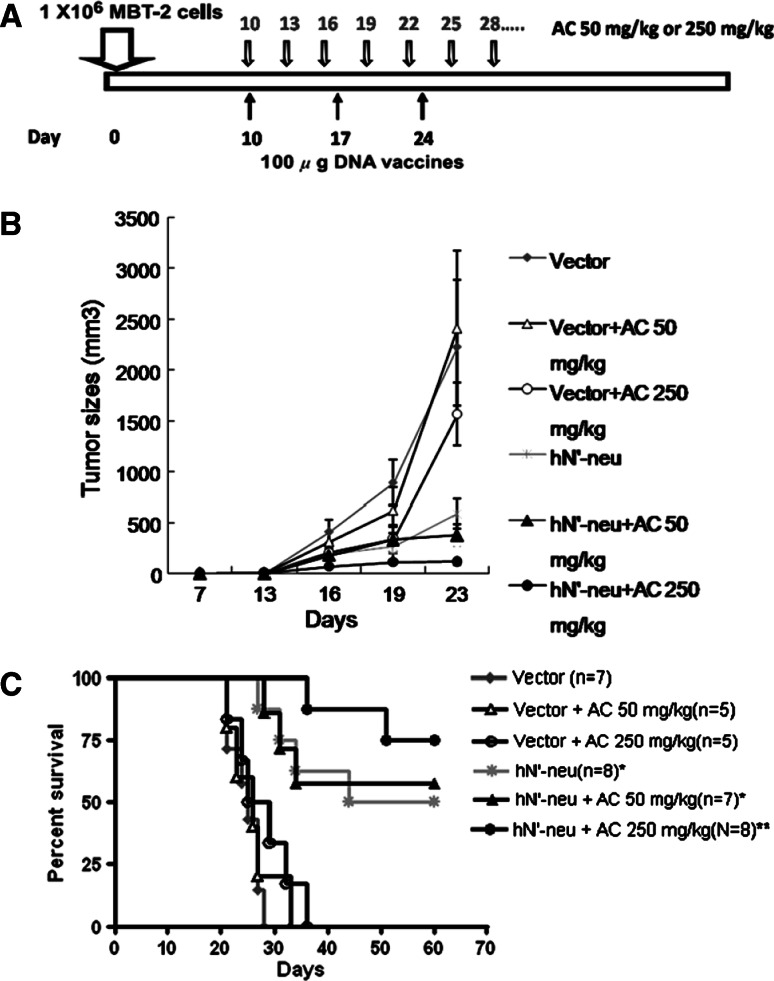
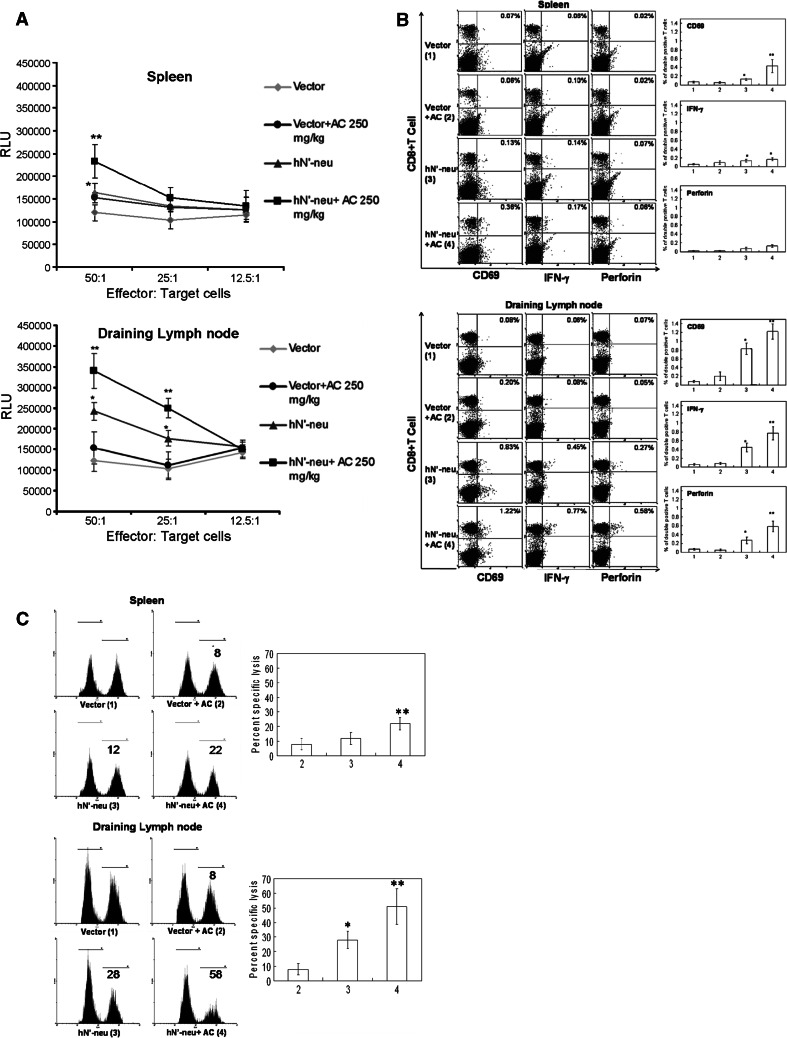
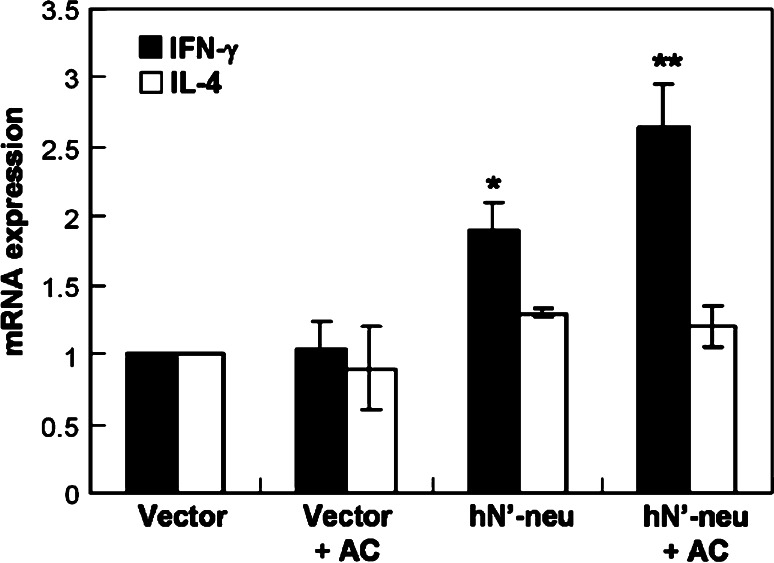
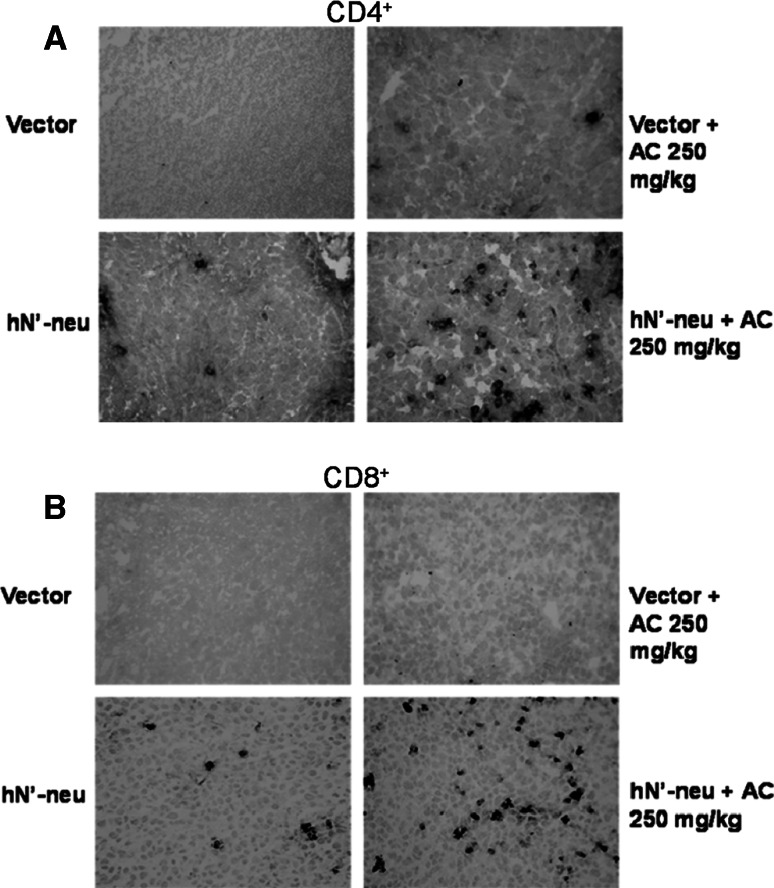
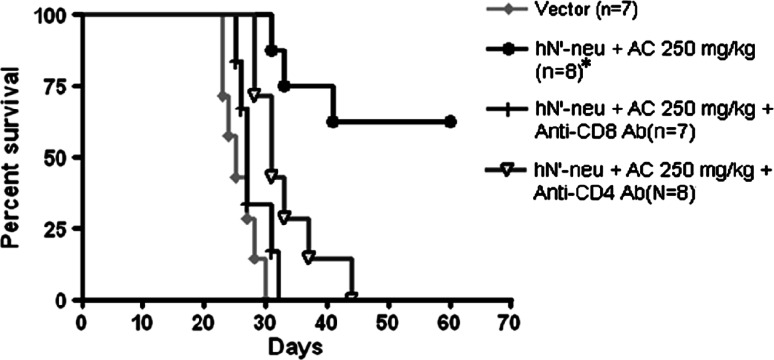
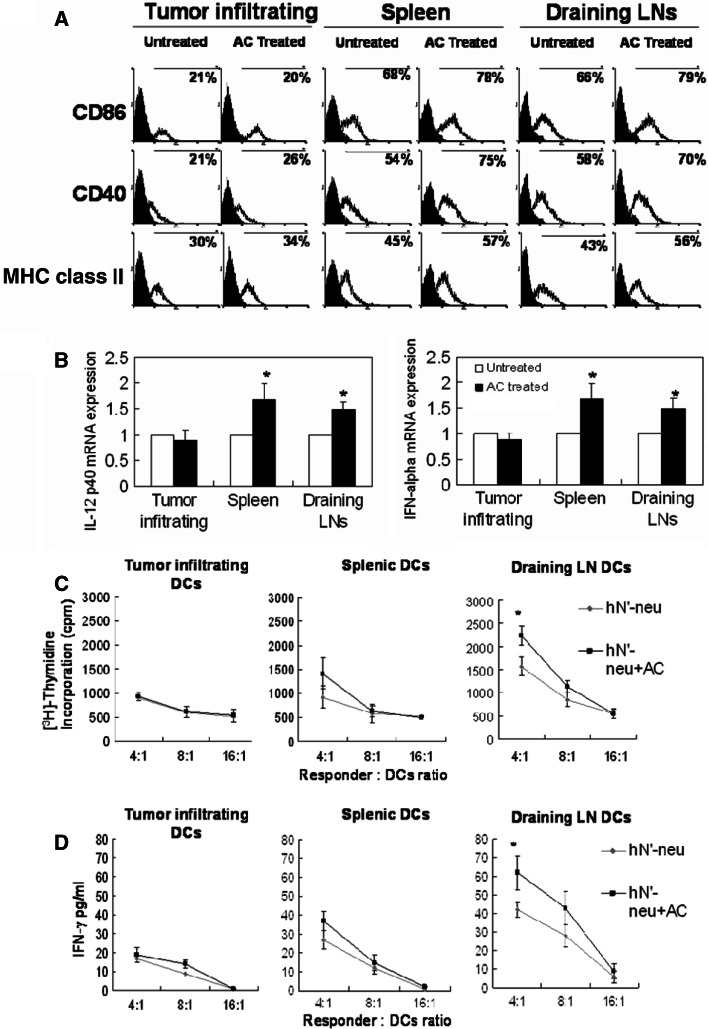
It is well known that DNA vaccines induce protective humoral and cell-mediated immune responses in several animal models. Antrodia camphorata (AC) is a unique basidiomycete fungus of the Polyporaceae family that only grows on the aromatic tree Cinnamomum kanehirai Hayata (Lauraceae) endemic to Taiwan. Importantly, AC has been shown to be highly beneficial in the treatment and prevention of cancer. The goal of this study was to investigate whether AC is able to augment the antitumor immune properties of a HER-2/neu DNA vaccine in a mouse model in which p185neu is overexpressed in MBT-2 tumor cells. Compared with the mice that received the HER-2/neu DNA vaccine alone, co-treatment with AC suppressed tumor growth and extended the survival rate. This increase in the antitumor efficacy was attributed to the enhancement of the Th1-like cellular immune response by the HER-2/neu DNA vaccine-AC combination. Evidence for this came from the marked increase in the IFN-gamma mRNA expression in CD4+ T cells in the draining inguinal lymph nodes, an increase in the number of functional HER-2/neu-specific CTLs, and the increased tumor infiltration of both CD4+ and CD8+ T cells, depletion of which abolishes the antitumor effect of the HER-2/neu DNA vaccine-AC therapy. Our results further indicate that the treatment of mice with AC enhanced DC activation and production of Th1-activating cytokines (e.g. IL-12, and IFN-alpha) in the draining lymph nodes, which were sufficient to directly stimulate T cell proliferation and higher IFN-gamma production in response to ErbB2. Overall, these results clearly demonstrate that AC represents a promising immunomodulatory adjuvant that could enhance the therapeutic potency of HER-2/neu DNA vaccines in cancer therapy.


Figures

Fig. 1
Fig. 1
AC reduces growth and induces apoptosis in MBT-2 cancer cell lines but not in MBT-2 tumor-bearing C3H/HeN mice. a MBT-2 cells were cultured for 48, 72 h in the presence of 62.5, 100, or 250 μg/ml of AC. Cell viability was determined using the MTT assay and the results are presented as the mean ± SEM of triplicate wells for each condition of duplicate experiments. b MBT-2 cells were treated with or without AC for 48 h. Apoptotic cells were detected using flow cytometry following AnnexinV–FITC staining and PI exclusion. AnnexinV-positive cells were regarded as apoptotic cells. The number in each quadrant indicates the proportion of positive cells present in that quadrant and is expressed as the percentage of total cells. The data shown are representative of three independent experiments with similar results. c Kaplan–Meier plot of survival data. A dose of either 50 or 250 mg/kg AC did not significantly alter the survival of mice when compared with untreated controls (with tumors). The experiments were repeated two times and similar results were obtained. d TUNEL staining of apoptotic DNA fragmentation in MBT-2 tumors sections from untreated control animals and animals treated wit the AC extract. The dark brown nuclei indicate apoptotic cells. The number of apoptotic cells was counted under high-power in five randomly chosen fields for each sample. The bar graph represents the mean ± SEM with six mice per group pooled from two independent experiments
Fig. 2
Fig. 2
Therapeutic effects of AC and HER-2/neu DNA vaccination in MBT-2 tumor-carrying C3H/HeN mice. a The treatment regimen for mice treated with the HER-2/neu DNA vaccine–AC combination. Ten days after s.c. MBT-2 cell inoculation, AC was administered orally daily and the mice were vaccinated with hN’-neu DNA vaccine three times at weekly intervals using a gene gun. b The tumor volume was measured at the indicated time. Mean values of five to eight mice per group ± SEM are shown. c The Kaplan–Meier survival curve for the different groups of tumor-challenged mice. Asterisk indicates a statistically significant difference when compared with control vector group (p < 0.05). Double asterisks indicate a statistically significant difference when compared with the hN’-neu DNA vaccine alone group (p < 0.05). The experiments were repeated two times and similar results were obtained
Fig. 3
Fig. 3
AC-mediated CTL activation and increase of HER-2/neu-specific functional CD8+ T cells in draining LN cells from hN’-neu vaccinated C3H/HeN mice. a In vitro cytotoxicity was assayed using luciferase-expressing MBT-2 cells as targets. Effector cells were prepared from the spleen and draining inguinal LNs from the different groups. To evaluate CTL activation in vitro, effector cells were incubated with serial dilutions of target cells, and cytotoxicity was quantified by measuring luciferase activity released from the target cells. The data are presented as the mean ± SEM of three mice per group from a single experiment. The experiments were repeated two times and similar results were obtained. b The percentage of CD69-expressing, IFN-producing, or perforin-producing CD8+ cells in 3 × 104 lymphocyte gate of spleens or draining LNs in the presence of the recombinant extracellular domain of human ErbB2 was determined using flow cytometry. The dot plot shows data from one representative mouse of each group. The bar graphs represent the mean ± SEM with six mice per group pooled from two independent experiments. c Recombinant human ErbB20-pulsed splenocytes or draining inguinal LNs were used as target cells to assess in vivo CTL activity. The numbers represent the percent reduction in the target population (right peak) compared with the control population (left peak). The histogram shows data from one representative mouse of each group. The bar graphs represent the mean ± SEM with six mice per group pooled from two independent experiments. Double asterisks indicate a statistically significant difference when compared with the hN’-neu DNA vaccine alone group (p < 0.05). Asterisk indicates a statistically significant difference when compared with the control vector group (p < 0.001)
Fig. 4
Fig. 4
Expression of IFN-γ and IL-4 mRNAs in HER-2/neu-specific CD4+ T cells from vaccinated mice by quantitative real-time RT-PCR analysis. IFN-γ and IL-4 mRNA expressions in purified CD4+ T cells isolated from draining inguinal LNs of different groups and stimulated with the recombinant extracellular domain of human ErbB2 was determined using quantitative real-time RT-PCR. The data were normalized to HPRT expression in each sample and are presented as the mean ± SEM with six mice per group pooled from two independent experiments. Double asterisks indicate a statistically significant difference when compared with mice vaccinated with the hN’-neu DNA vaccine alone (p < 0.05). Asterisk indicates a statistically significant difference when compared with mice vaccinated with the control vector (p < 0.001)
Fig. 5
Fig. 5
Tumor infiltration of CD4+ and CD8+ T cells. Tumors were excised from mice treated with either the HER-2/neu DNA vaccine, AC, or both. The infiltration of CD4+ (a) and CD8+ (b) T cells was determined in cryosections following staining with primary antibodies specific for CD4 or CD8. A peroxidase-conjugated antibody was used as the secondary antibody. The dark spots indicate positive cells (×400)
Fig. 6
Fig. 6
The effect of CD4+ or CD8+ T cell depletion on the therapeutic effects of co-administration of AC and HER-2/neu DNA vaccination in MBT-2 tumor-carrying C3H/HeN mice. The life span of C3H/HeN mice after s.c. challenge with MBT-2 tumor cells is also shown. Asterisk indicates a statistically significant difference compared to the control vector group (p < 0.01). Similar data were obtained in two independent experiments
Fig. 7
Fig. 7
Phenotypic and functional characterization of CD11c+ DCs purified from draining inguinal LNs, spleen, or the tumor site in the different groups of mice. a CD11c+ DCs were purified from AC-treated or untreated control mice using MACS and stained with Abs to detect CD40, CD86, and I-Ak (MHC class II). The values in open histograms indicate the percentage of cells within the indicated gate. The filled histograms represent staining with the isotype-matched mAb control. Staining with the isotype control resulted in less than 2% positive cells (not shown). The histogram data are representative of two independent experiments that yielded similar results. b. IFN-α and IL-12 mRNA were detected in purified CD11c+ DC from AC-treated or untreated control mice using quantitative real-time RT-PCR. The data were normalized to HPRT expression in each sample, and means ± SEM are pooled from two independent experiments (n = 10–14 mice/group). Asterisk indicates a statistically significant difference when compared with untreated control group (p < 0.05). c, d Effect of CD11c+ cells from hN’-neu-treated or hN’-neu DNA-AC-treated mice on ErbB2 antigen-stimulated T cell responses. Purified CD11c+ cells were irradiated and then incubated with T cells from hN’-neu DNA vaccinated mice. The proliferative capacity (c) and IFN-γ cytokine production (d) were measured as described in the “Material and methods”. Data shown in the figure represent mean ± SEM of triplicate wells from a single experiment (n = 5–7 mice/group). The experiments were repeated two times and similar results were obtained. Asterisk indicates a statistically significant difference when compared with mice vaccinated with the hN’-neu DNA vaccine alone (p < 0.05)

Similar articles

Cited by

References

    1. Choo AY, Choo DK, Kim JJ, Weiner DB. DNA vaccination in immunotherapy of cancer. Cancer Treat Res. 2005;123:137–156. doi: 10.1007/0-387-27545-2_6. - DOI - PubMed
    1. Cavallo F, Offringa R, van der Burg SH, Forni G, Melief CJ. Vaccination for treatment and prevention of cancer in animal models. Adv Immunol. 2006;90:175–213. doi: 10.1016/S0065-2776(06)90005-4. - DOI - PubMed
    1. Quaglino E, Iezzi M, Mastini C, Amici A, Pericle F, Di Carlo E, Pupa SM, De Giovanni C, Spadaro M, Curcio C, Lollini PL, Musiani P, Forni G, Cavallo F. Electroporated DNA vaccine clears away multifocal mammary carcinomas in her-2/neu transgenic mice. Cancer Res. 2004;64:2858–2864. doi: 10.1158/0008-5472.CAN-03-2962. - DOI - PubMed
    1. Lu Y, Wei YQ, Tian L, Zhao X, Yang L, Hu B, Kan B, Wen YJ, Liu F, Deng HX, Li J, Mao YQ, Lei S, Huang MJ, Peng F, Jiang Y, Zhou H, Zhou LQ, Luo F. Immunogene therapy of tumors with vaccine based on xenogeneic epidermal growth factor receptor. J Immunol. 2003;170:3162–3170. - PubMed
    1. Kim D, Hoory T, Wu TC, Hung CF. Enhancing DNA vaccine potency by combining a strategy to prolong dendritic cell life and intracellular targeting strategies with a strategy to boost CD4+ T cell. Hum Gene Ther. 2007;18:1129–1139. doi: 10.1089/hum.2007.090. - DOI - PMC - PubMed

Publication types

MeSH terms