. 2010 Jun 11;285(24):18909-17.
doi: 10.1074/jbc.M110.102145. Epub 2010 Apr 14.

New roles for cyclin E in megakaryocytic polyploidization

Affiliations

New roles for cyclin E in megakaryocytic polyploidization

Alexia Eliades et al. J Biol Chem. .

Abstract

Megakaryocytes are platelet precursor cells that undergo endomitosis. During this process, repeated rounds of DNA synthesis are characterized by lack of late anaphase and cytokinesis. Physiologically, the majority of the polyploid megakaryocytes in the bone marrow are cell cycle arrested. As previously reported, cyclin E is essential for megakaryocyte polyploidy; however, it has remained unclear whether up-regulated cyclin E is an inducer of polyploidy in vivo. We found that cyclin E is up-regulated upon stimulation of primary megakaryocytes by thrombopoietin. Transgenic mice in which elevated cyclin E expression is targeted to megakaryocytes display an increased ploidy profile. Examination of S phase markers, specifically proliferating cell nuclear antigen, cyclin A, and 5-bromo-2-deoxyuridine reveals that cyclin E promotes progression to S phase and cell cycling. Interestingly, analysis of Cdc6 and Mcm2 indicates that cyclin E mediates its effect by promoting the expression of components of the pre-replication complex. Furthermore, we show that up-regulated cyclin E results in the up-regulation of cyclin B1 levels, suggesting an additional mechanism of cyclin E-mediated ploidy increase. These findings define a key role for cyclin E in promoting megakaryocyte entry into S phase and hence, increase in the number of cell cycling cells and in augmenting polyploidization.


Figures

FIGURE 1.
FIGURE 1.
Effect of TPO on cyclin E levels in MKs. A, left panel, MKs were isolated from freshly derived wild-type bone marrow cells using MACS® magnetic bead purification system (Control, MK-depleted bone marrow fraction; MK, megakaryocyte-enriched fraction) as described under “Experimental Procedures.” Purity of the MK-enriched fraction was estimated by flow cytometry analysis of the CD41-positive population. Data represent the average of two independent experiments. Right panel, example of enrichment of CD41-FITC labeled MKs as assessed by fluorescence microscopy. B, wild-type MKs were stimulated for 0, 6, and 12 h with 25 ng/ml TPO. RNA was extracted from the MK cultures and quantitative RT- PCR analysis was applied to measure the levels of cyclin E. GAPDH was used as an internal control. Data represent the mean of three experiments and statistical analysis was applied using the Student's t test for paired values, n = 3, *, p < 0.05. C, left panel, Western blot analysis was applied to determine the levels of cyclin E. Wild-type MKs were stimulated for 0 and 12 h with 25 ng/ml TPO, and protein was extracted and subjected to SDS-PAGE as described under “Experimental Procedures.” Cyclin E was detected with a rabbit polyclonal anti-cyclin E antibody, and β-actin was used as loading control. One representative, out of three experiments, is shown. Right panel, total cyclin E protein expression was normalized to β-actin and presented as fold change. Quantification was performed by using the NIH ImageJ software (version 1.41o). The data shown represent the averages ± S.D. of three experiments using the Student's t test, *, p < 0.05. D, ploidy distribution upon stimulation of megakaryocytes with 25 ng/ml TPO (Control, unstimulated MKs, TPO, 3-day-stimulated MKs). One representative out of three experiments is shown.
FIGURE 2.
FIGURE 2.
Expression analysis of the cyclin E-overexpressing mouse model. A, tail genomic DNA was isolated from founders and their progenies to confirm insertion of the transgene via PCR analysis using human cyclin E-specific primers. DNA from wild-type mouse was used as a negative control. B, quantitative RT- PCR was applied to verify RNA expression (shown here is line 11). Taqman human cyclin E1 primers were used, and data were normalized to GAPDH via the ΔΔCT method. Murine cyclin E1 expression was also determined, using specific Taqman murine cyclin E1 primers, p > 0.05. C, left panel, Western blot analysis shows human cyclin E expression at the protein level in two founder lines (11, 38) using purified MK lysates. Human cyclin E (h-cyclin E) was detected with anti-human cyclin E antibody. The same amount of protein extract from HeLa cells was used as a positive control. Anti-β-actin was used as loading control. Right panel, Western blot analysis verifies that transgene expression is specific to MKs. MKs were enriched using the MACS® system as described under “Experimental Procedures.” The rest of the BM fraction (MK depleted-BM) was used to confirm that h-cyclin E is specific to MKs. CD41 antibody was used as MK marker. D, Western blot analysis using an antibody that detects both human and murine cyclin E shows that total levels of cyclin E are up-regulated in freshly derived cells from transgenic mice and Wt controls. One representative out of three experiments is shown. h-cyclin E, human cyclin E. E, protein expression for total cyclin E (shown in panel D) was normalized to β-actin and presented as fold change. Quantification was performed by using the NIH ImageJ software (version 1.41o). The data shown represent the averages ± S.D. of three experiments using the Student's t test; **, p < 0.001. Wt, wild-type MKs; CycE, cyclin E transgenic MKs.
FIGURE 3.
FIGURE 3.
Immunofluorescence detection of hCyclin E in MKs. Immunofluorescence microscopy confirms human cyclin E expression in bone marrow-derived MKs of the transgenic mouse model (line 11 is shown) or wild-type matching controls (Wt). Human cyclin E (hcyclin E) antibody was used, followed by a secondary staining with goat anti- mouse Alexa-488 as described under “Experimental Procedures.” HeLa cells were used as a positive control. Cells were also stained with DAPI (blue) to visualize DNA using fluorescent microscopy. Large polyploid MKs are readily identifiable.
FIGURE 4.
FIGURE 4.
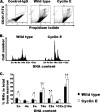
Effect of cyclin E overexpression on MK polyploidy. MK ploidy distribution from freshly isolated Wt and cyclin E transgenic (line 11) bone marrow cells. A, ploidy was measured after labeling MKs with anti-CD41-FITC-conjugated antibody and DNA staining with propidium iodide, followed by flow cytometry. IgG-FITC conjugated antibody was used as a negative control. Flow cytometry dot plot from IgG control and representative plots from Wt and cyclin E BM analysis are shown. B, one representative histogram out of six is shown per group (Wt, cyclin E). C, graphic representation of the percentage of MKs in each ploidy class. Error bars represent the S.D. from the mean of six experiments, *, p < 0.05; **, p ≤ 0.0001.
FIGURE 5.
FIGURE 5.
Analysis of S phase markers in Wt and cyclin E-overexpressing MKs. A, Western blot for PCNA and cyclin A was performed in purified MKs (as under “Experimental Procedures”). B, protein expression for PCNA and cyclin A was normalized to β-actin and presented as fold change. Quantification was performed by using the NIH ImageJ software (version 1.41o). The data shown represent the averages ± S.D. of 4 and 3 experiments for PCNA and cyclin A, respectively using the Student's t test, *, p < 0.05. C, summary of BrdU incorporation in MKs. A total of 3 mice per group (Wt, cyclin E transgenic) were used. Non-MK bone marrow cells had similar percentage of BrdU incorporation in both groups (data not shown). D, example of BrdU positive staining of MK (I) and non-MK bone marrow cells (II). Immunofluoresence microscopy was applied using FITC-BrdU antibody as described under “Experimental Procedures.” Cells were also stained with DAPI to visualize DNA.
FIGURE 6.
FIGURE 6.
Analysis of S phase entry regulators in isolated MKs from Wt and cyclin E transgenic mice. A, MK enriched fraction was collected, and total protein was extracted and subjected to SDS-PAGE. Proteins were detected by Western blotting with the indicated antibodies. B, protein expression of Mcm2 and Cdc6 was normalized to β-actin and presented as fold change. Quantification was performed by using the NIH ImageJ software (version 1.41o). The data shown represent the averages ± S.D. of 4 and 5 experiments for Cdc6 and Mcm2, respectively, using the Student's t test, *, p < 0.05.
FIGURE 7.
FIGURE 7.
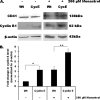
Effect of cyclin E overexression on cyclin B levels. A, Western blot analysis of cyclin B1 in non-synchronized and monastrol-synchronized MKs derived from Wt and cyclin E Tg mice. For cell cycle synchronization, enriched MKs were treated with 200 μm Monastrol as described under “Experimental Procedures.” B, protein expression of cyclin B was normalized to β-actin and presented as fold change. Quantification was performed by using the NIH ImageJ software (version 1.41o). The data shown represent the averages ± S.D. of three experiments using the Student's t test, *, p < 0.05; **, p < 0.0005.

Similar articles

Cited by

References

    1. Balduini C. L., Savoia A. (2004) Semin. Thromb. Hemost. 30, 513–523 - PubMed
    1. Kaushansky K. (2005) J. Clin. Invest. 115, 3339–3347 - PMC - PubMed
    1. Ravid K., Lu J., Zimmet J. M., Jones M. R. (2002) J. Cell. Physiol. 190, 7–20 - PubMed
    1. Kaushansky K., Drachman J. G. (2002) Oncogene 21, 3359–3367 - PubMed
    1. Deutsch V. R., Tomer A. (2006) Br. J. Haematol. 134, 453–466 - PubMed

Publication types