

Ischemia/reperfusion reduces transcription factor Sp1-mediated cystathionine beta-synthase expression in the kidney
- PMID: 20392694
- PMCID: PMC2881747
- DOI: 10.1074/jbc.M110.132142
Ischemia/reperfusion reduces transcription factor Sp1-mediated cystathionine beta-synthase expression in the kidney
Abstract
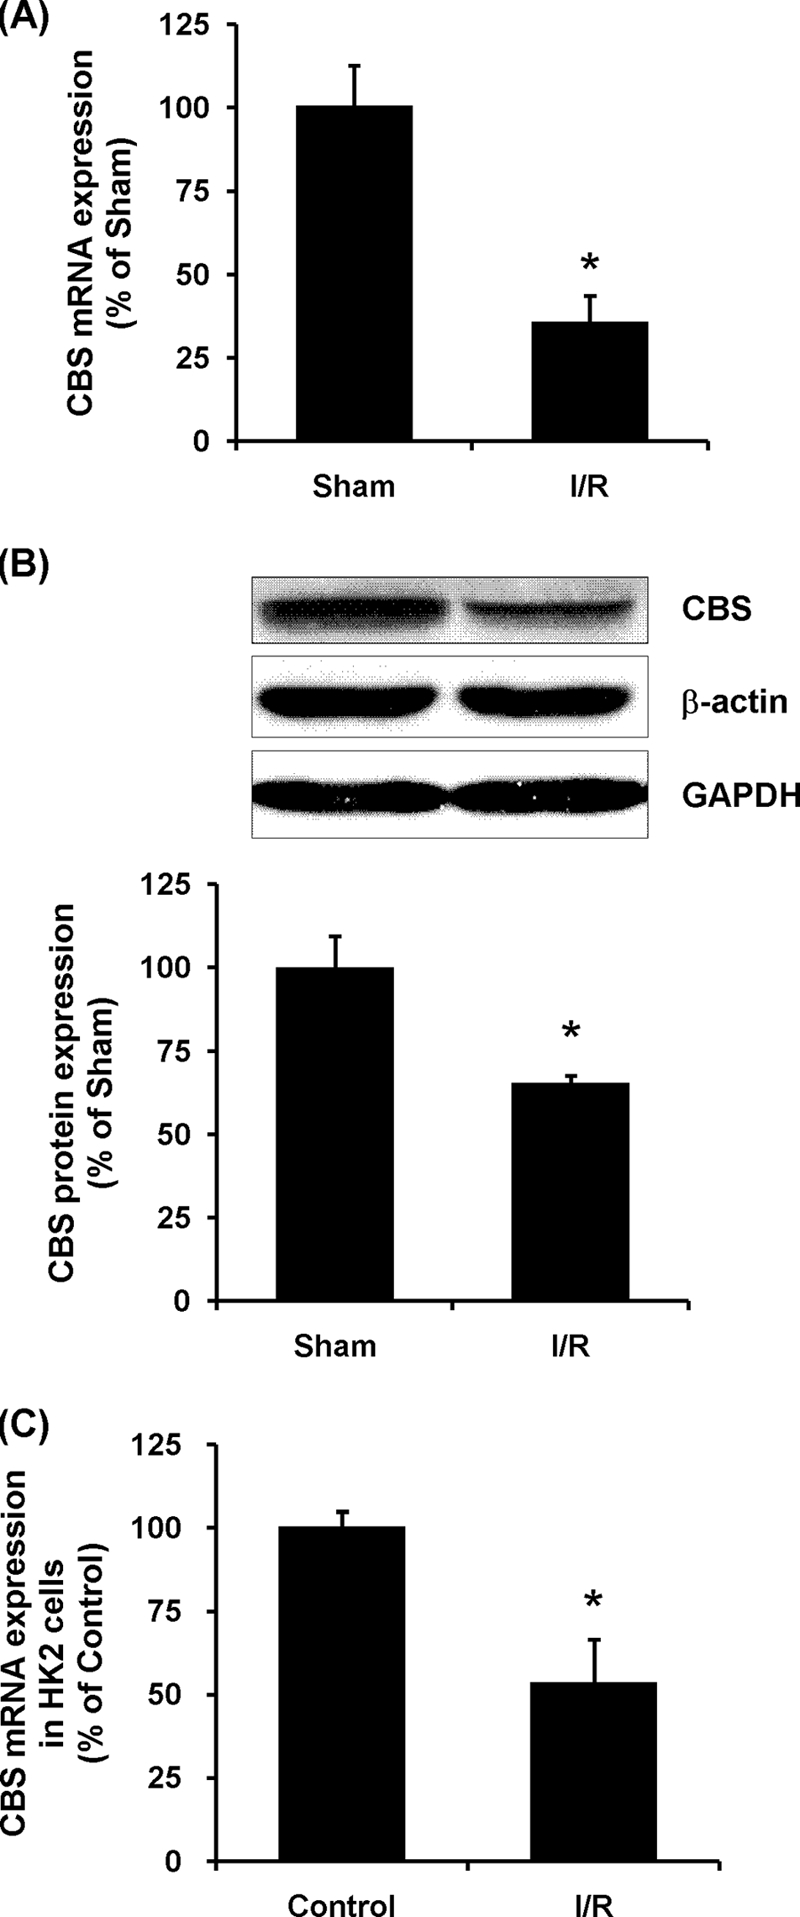
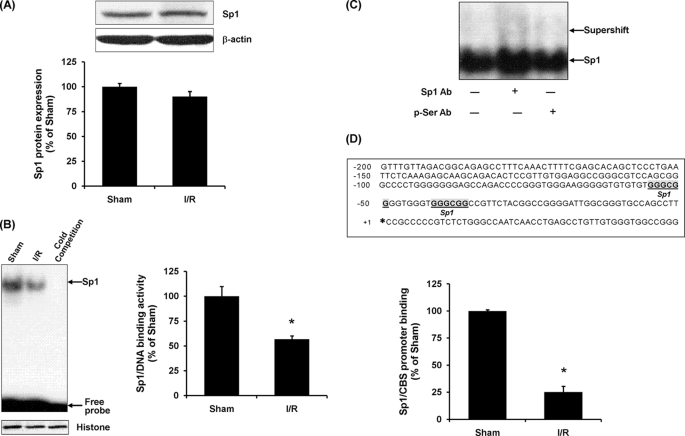
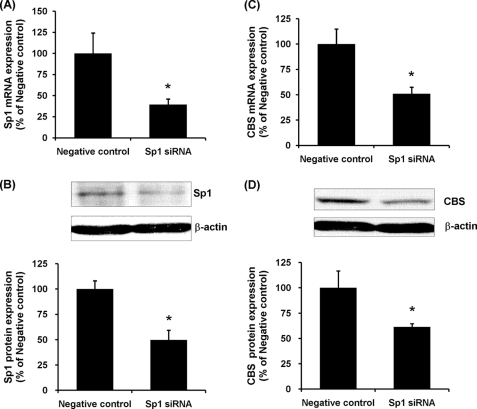
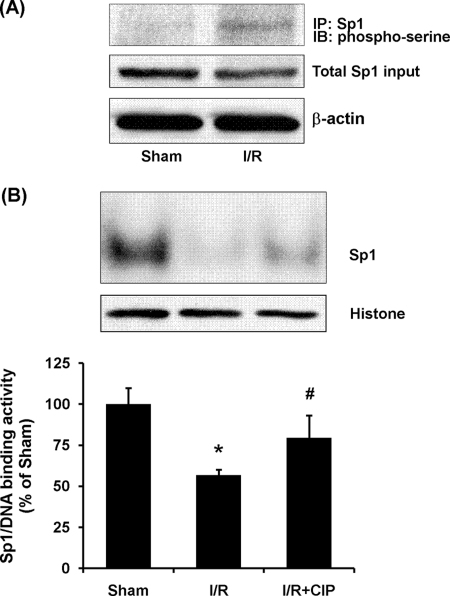
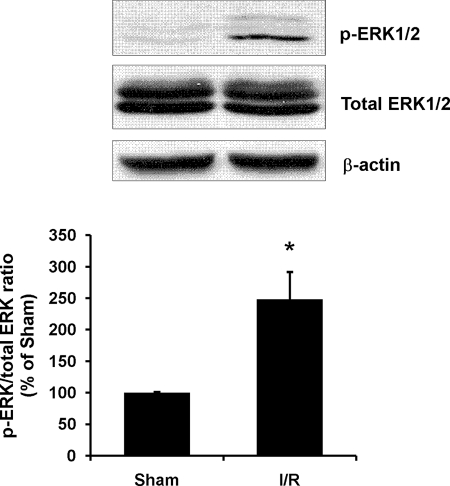
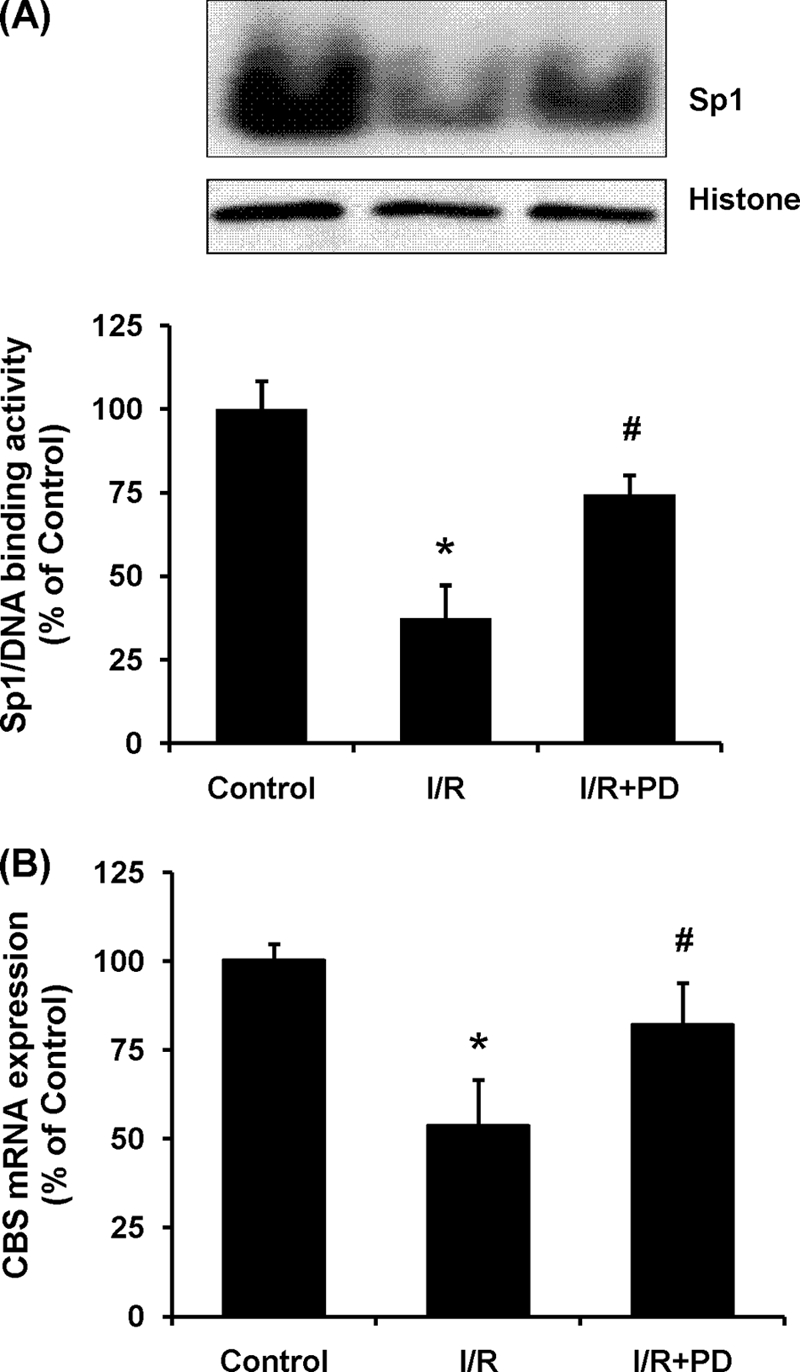
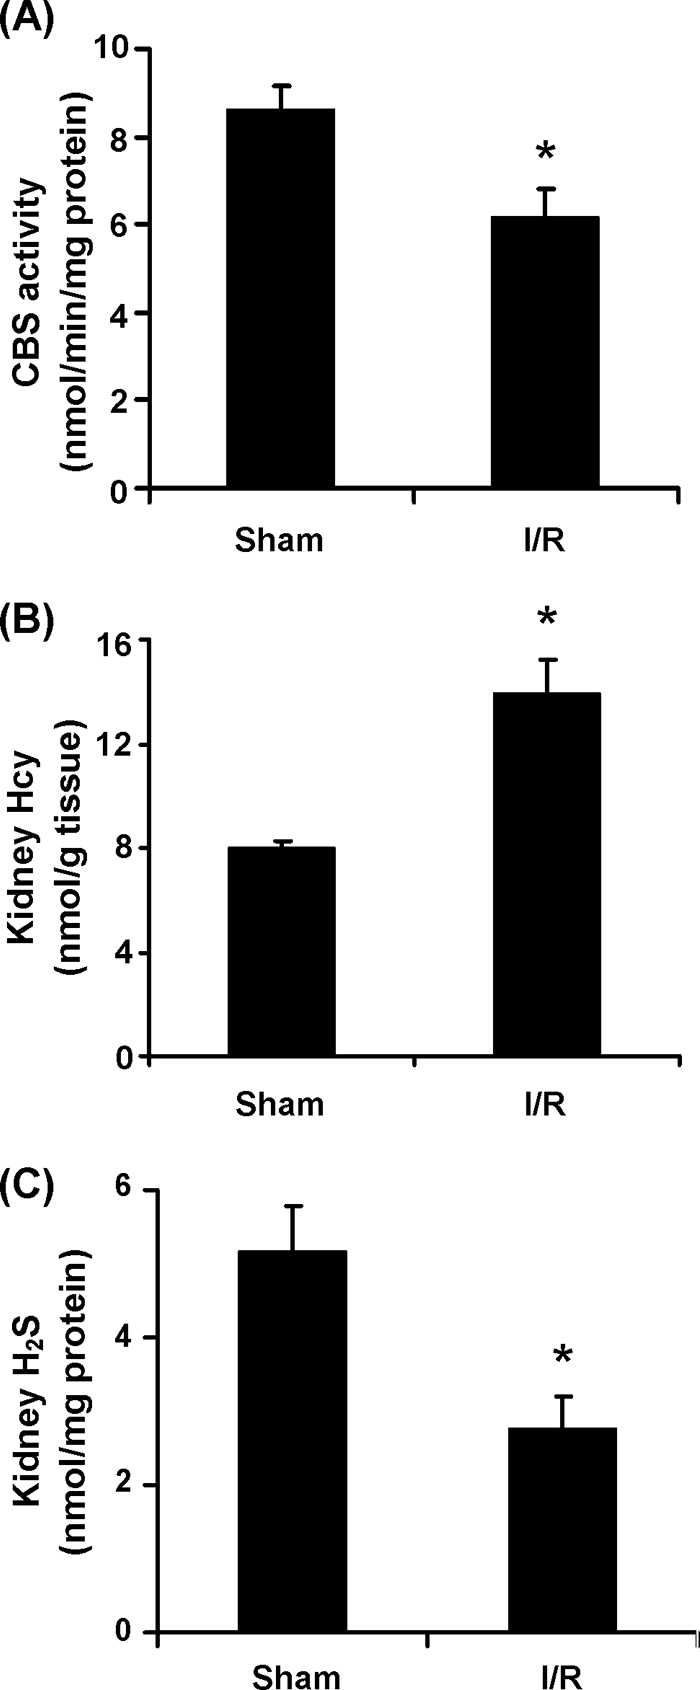
Cystathionine beta-synthase (CBS) is a key enzyme that catalyzes the rate-limiting step for homocysteine (Hcy) metabolism via the trans-sulfuration pathway and is also responsible for the production of H(2)S through the desulfhydration reaction. Our recent studies demonstrate that renal ischemia/reperfusion decreased the CBS activity leading to Hcy accumulation and H(2)S reduction in the kidney, which in turn contributed to kidney injury. Both Hcy and H(2)S play important roles in physiological and pathological processes. In this study we investigated the molecular mechanism by which CBS activity was regulated in the kidney. The left kidney of Sprague-Dawley rat was subjected to 45 min of ischemia followed by 6 h of reperfusion. Ischemia/reperfusion caused a significant decrease in CBS mRNA and protein levels in the kidney. As a consequence, there was a marked reduction in the CBS enzyme activity. Transfection of kidney proximal tubular cells with transcription factor (Sp1) small interfering RNA caused a marked reduction in CBS mRNA, indicating a pivotal role for Sp1 in regulating CBS expression in kidney cells. Electrophoretic mobility shift assay and chromatin immunoprecipitation assay detected a lower Sp1 activity in kidneys subjected to ischemia/reperfusion as compared with that in a sham-operated group. ERK-mediated phosphorylation of Sp1 was responsible for a decreased transcriptional activity of Sp1 in the kidney upon ischemia/reperfusion. These results suggest that reduced kidney CBS gene expression during ischemia/reperfusion is mediated via a decrease in Sp1 transcriptional activity. Regulation of CBS-mediated Hcy and H(2)S homeostasis may offer a renal protective effect against ischemia/reperfusion injury.
Figures
Similar articles
-
Ischemia-reperfusion reduces cystathionine-beta-synthase-mediated hydrogen sulfide generation in the kidney.Am J Physiol Renal Physiol. 2009 Jul;297(1):F27-35. doi: 10.1152/ajprenal.00096.2009. Epub 2009 May 13. Am J Physiol Renal Physiol. 2009. PMID: 19439522
-
Inhibition of cystathionine-beta-synthase activity during renal ischemia-reperfusion: role of pH and nitric oxide.Am J Physiol Renal Physiol. 2008 Oct;295(4):F912-22. doi: 10.1152/ajprenal.00040.2008. Epub 2008 Aug 13. Am J Physiol Renal Physiol. 2008. PMID: 18701635
-
Transcriptional regulation of cell-specific expression of the human cystathionine beta -synthase gene by differential binding of Sp1/Sp3 to the -1b promoter.J Biol Chem. 2001 Nov 23;276(47):43570-9. doi: 10.1074/jbc.M104930200. Epub 2001 Sep 18. J Biol Chem. 2001. PMID: 11562358
-
Cystathionine beta-Synthase in hypoxia and ischemia/reperfusion: A current overview.Arch Biochem Biophys. 2022 Mar 30;718:109149. doi: 10.1016/j.abb.2022.109149. Epub 2022 Feb 12. Arch Biochem Biophys. 2022. PMID: 35157853 Review.
-
Hydrogen sulfide generation in mammals: the molecular biology of cystathionine-β- synthase (CBS) and cystathionine-γ-lyase (CSE).Inflamm Allergy Drug Targets. 2011 Apr;10(2):85-91. doi: 10.2174/187152811794776286. Inflamm Allergy Drug Targets. 2011. PMID: 21275900 Review.
Cited by
-
Role of Cystathionine Gamma-Lyase in Immediate Renal Impairment and Inflammatory Response in Acute Ischemic Kidney Injury.Sci Rep. 2016 Jun 8;6:27517. doi: 10.1038/srep27517. Sci Rep. 2016. PMID: 27273292 Free PMC article.
-
Interactive roles of Ets-1, Sp1, and acetylated histones in the retinoic acid-dependent activation of guanylyl cyclase/atrial natriuretic peptide receptor-A gene transcription.J Biol Chem. 2010 Nov 26;285(48):37521-30. doi: 10.1074/jbc.M110.132795. Epub 2010 Sep 23. J Biol Chem. 2010. PMID: 20864529 Free PMC article.
-
Downregulation of Glutathione Biosynthesis Contributes to Oxidative Stress and Liver Dysfunction in Acute Kidney Injury.Oxid Med Cell Longev. 2016;2016:9707292. doi: 10.1155/2016/9707292. Epub 2016 Oct 30. Oxid Med Cell Longev. 2016. PMID: 27872680 Free PMC article.
-
Hydrogen sulfide: physiological properties and therapeutic potential in ischaemia.Br J Pharmacol. 2015 Mar;172(6):1479-93. doi: 10.1111/bph.12869. Br J Pharmacol. 2015. PMID: 25091411 Free PMC article. Review.
-
Uremic Toxin Indoxyl Sulfate Impairs Hydrogen Sulfide Formation in Renal Tubular Cells.Antioxidants (Basel). 2022 Feb 11;11(2):361. doi: 10.3390/antiox11020361. Antioxidants (Basel). 2022. PMID: 35204244 Free PMC article.
References
-
- Eto K., Kimura H. (2002) J. Biol. Chem. 277, 42680–42685 - PubMed
-
- Wang L., Jhee K. H., Hua X., DiBello P. M., Jacobsen D. W., Kruger W. D. (2004) Circ. Res. 94, 1318–1324 - PubMed
-
- Lentz S. R. (2005) J. Thromb. Haemost. 3, 1646–1654 - PubMed
-
- Refsum H., Ueland P. M., Nygård O., Vollset S. E. (1998) Annu. Rev. Med. 49, 31–62 - PubMed
Publication types
MeSH terms
Substances
LinkOut - more resources
Full Text Sources
Research Materials
Miscellaneous
