. 2010 Jun 25;285(26):19793-801.
doi: 10.1074/jbc.M110.108803. Epub 2010 Apr 14.

Choline promotes nicotinic receptor alpha4 + beta2 up-regulation

Affiliations

Choline promotes nicotinic receptor alpha4 + beta2 up-regulation

Lorise C Gahring et al. J Biol Chem. .

Abstract

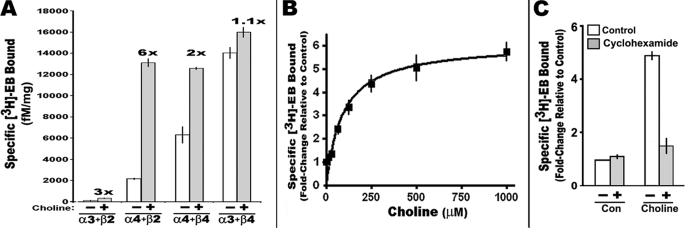
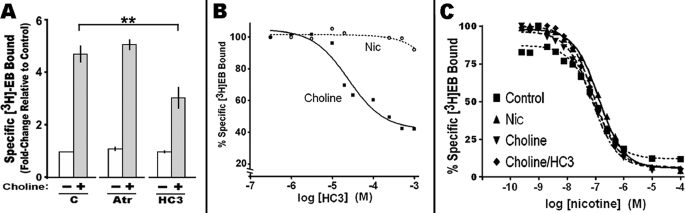
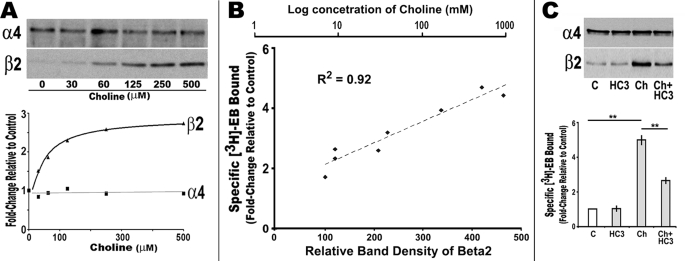
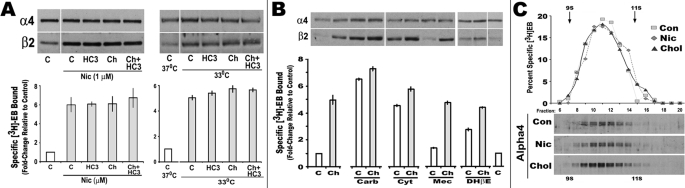
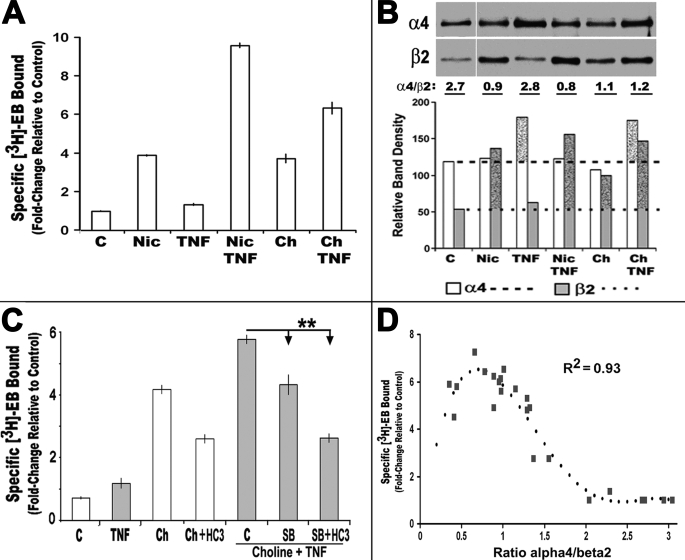
Neuronal nicotinic acetylcholine receptors (nAChR) composed of alpha4 + beta2 subunits, the high affinity nicotine-binding site in the mammalian brain, up-regulate in response to chronic nicotine exposure. The identities of endogenous mediators of this process are unknown. We find that choline also up-regulates alpha4 + beta2 nAChRs stably expressed by HEK293 cells as measured by increased [(3)H]epibatidine density. Choline-mediated up-regulation is dose-dependent and corresponds with an increase in beta2 subunit protein expression. The choline kinase inhibitor hemicholinium-3 inhibits approximately 60% of choline-mediated up-regulation revealing both an HC3-dependent and -independent pathway. Furthermore, choline-mediated up-regulation is not additive with up-regulation agents such as nicotine, but it is additive with weaker promoters of the up-regulation process. When co-applied with the pro-inflammatory cytokine tumor necrosis factor alpha, choline-mediated up-regulation is increased further through a mechanism that includes an increase in both alpha4 and beta2 protein expression, and this is inhibited by the p38 MAPK inhibitor SB202190. These findings extend the view that up-regulation of alpha4 + beta2 nAChRs is a normal physiological response to altered metabolic and inflammatory conditions.


Figures

FIGURE 1.
FIGURE 1.
Influence of choline on [3H]EB-binding site density in 293 cells stably expressing nAChRs of different subunit composition. A, cells expressing the indicated nicotinic receptor subunits were grown in the presence of 500 μm choline chloride for 24 h before measuring specific [3H]EB binding to the crude cell membrane fraction (see under “Experimental Procedures”). Results are expressed as the density of nAChR [3H]EB-binding sites per fm/mg protein. The calculated fold-change of choline versus control binding is shown above each cell group. B, dose response for choline-mediated up-regulation of [3H]EB-binding sites of α4β2 receptors. The Kd value for up-regulation by choline was 92.5 μm (nonlinear least square regression and one-site saturation binding model of the Prism 4.03 software). C, choline up-regulation of [3H]EB sites was inhibited by 10 μm cycloheximide. All values are normalized to the control (con) (saline and saline plus cycloheximide-only treatments). Error bars reflect mean ± S.E. calculated from three to six independent measurements for each experiment.
FIGURE 2.
FIGURE 2.
Choline-mediated up-regulation is through an atropine-insensitive, HC3 partially sensitive mechanism. A, cells expressing α4β2 were treated with atropine (Atr) (10 μm) or the choline kinase inhibitor HC3 before the addition of choline. Choline up-regulation relative to the control (C) was partially inhibited by HC3. B, dose response of the impact by HC3 on [3H]EB binding measured in the presence of either choline or nicotine (Nic). The plot curves were generated using the Prism 4.03 software. C, nicotine competition of [3H]EB binding to receptors from cells treated with nicotine, choline, or choline + HC3 versus the control (no treatment). The Ki for nicotine was ∼13.5 nm in all samples regardless of the treatment used to produce up-regulation. Error bars reflect mean ± S.E. from three independent measurements. **, p < 0.01.
FIGURE 3.
FIGURE 3.
Choline-mediated α4β2 up-regulation corresponds with increased β2 protein expression. A, cells expressing α4β2 were treated with varying amounts of choline (30–500 μm) for 18 h before collecting crude membranes for Western blot analysis of α4 and β2 expression (see under “Experimental Procedures”). The relative band density for each subunit as a fold-change relative to the control is shown below the gels, and a best fit line for each subunit is superimposed (GraphPad version 4.03). B, comparison of the relative band density of β2 to the specific fold-change in [3H]EB and choline treatment concentration as labeled. There is a highly significant correlation between the amount of β2 subunit protein measured and the relative increase in ligand binding induced by choline. C, HC3 decreases choline-mediated β2 subunit protein and up-regulation of [3H]EB. The relative expression of α4 and β2 protein and [3H]EB binding was measured in crude membrane fractions prepared from cells treated with HC3, choline (Ch) or choline + HC3 as indicated. The results of Western blot analysis and ligand binding are shown in the respective panels. Error bars reflect mean ± S.E. determined from three to six measurements. **, p < 0.01.
FIGURE 4.
FIGURE 4.
Choline-mediated shifts in β2 expression complement up-regulation processes without altering receptor shape. A, cells were then treated with choline (Ch), HC3, and/or nicotine (Nic) as indicated. Cells placed at 33 °C were stabilized at this temperature for 1 h before treating them as labeled and then continuing culture at 33 °C for at least an additional 18 h. Western blots for α4 or β2 were prepared as shown. [3H]EB binding was measured in crude membrane fractions prepared from cells treated in parallel. The results are for the average fold-increase from three experiments where all values were normalized to the control (1.0) and then summed. Error bars reflect mean ± S.E. B, cells were treated with other drugs that interact with nicotinic receptors either at the ligand-binding site, including carbacholamine (Carb), cytosine (Cyt), dihydro-β-erythroidine (DHβE), or as an open channel blocker as for mecamylamine (Mec). Cells were then treated with either vehicle (C, saline) or choline (Ch, 250 μm) and harvested for either as indicated. Parallel cells membrane preparations measured [3H]EB binding as in A. C, sedimentation profiles on sucrose gradients were performed on cells treated with either nicotine (Nic) or choline (Chol). Crude membranes from cells treated with choline or nicotine were prepared for this analysis as described under “Experimental Procedures.” Fractions were collected across the gradient, and the specific [3H]EB binding profiles are shown. Below is the Western blot analysis for α4 protein measured in fractions in the vicinity of 9 S to 11 S as indicated. The majority of ligand binding and α4 protein was localized to the 10 S to 10.5 S fractions. Con, control.
FIGURE 5.
FIGURE 5.
TNFα alone does not increase up-regulation of [3H]EB sites but enhances choline-mediated up-regulation. A, average fold-change in specific [3H]EB ligand binding by crude cell membranes from 293 cells treated with choline, nicotine, and/or TNFα, as indicated. (C, control; Nic, nicotine (1 μm); TNF, TNFα (25 nm); Ch, choline (250 μm)). B, Western blot analysis of α4 or β2 expression from crude membranes of cells treated as indicated. Cells exposed to choline increase β2 expression, and those exposed to TNFα exhibit increased protein for α4. The ratio of protein bands that is typical of multiple experiments is indicated below the gel as is the quantitative measure of band density for each subunit in each treatment group in this experiment. Dotted lines mark the respective control level of expression, and stippled bars indicate increase over control. C, TNFα enhancement of choline-mediated up-regulation is significantly inhibited by the highly specific p38 MAPK inhibitor, SB2020190 (10 μm). Choline (Ch) or choline plus TNFα (TNF)-treated cells were also treated with a combination of SB202190 (SB) and/or HC3 (**, p < 0.01). Each panel reflects results from three to eight independent experiments. D, up-regulation of α4β2 in stably transfected 293 cells is related to an optimal ratio of α4/β2 protein as measured on Western blots. Comparing this ratio with [3H]EB density collected from all treatments described in this study results in a best fit (optimal R2) for these data with the following equation: Y = −0.47 + 23.9x − 26.1x2 + 9.7x3 − 1.2x4 as calculated by the Prism version 4.03 software. Error bars are removed for clarity.

Similar articles

Cited by

References

    1. Flores C. M., Rogers S. W., Pabreza L. A., Wolfe B. B., Kellar K. J. (1992) Mol. Pharmacol. 41, 31–37 - PubMed
    1. Mao D., Perry D. C., Yasuda R. P., Wolfe B. B., Kellar K. J. (2008) J. Neurochem. 104, 446–456 - PubMed
    1. Albuquerque E. X., Pereira E. F., Alkondon M., Rogers S. W. (2009) Physiol. Rev. 89, 73–120 - PMC - PubMed
    1. Govind A. P., Vezina P., Green W. N. (2009) Biochem. Pharmacol. 78, 756–765 - PMC - PubMed
    1. Buisson B., Bertrand D. (2001) J. Neurosci. 21, 1819–1829 - PMC - PubMed

Publication types

MeSH terms