. 2010 Nov 6;7(52):1537-44.
doi: 10.1098/rsif.2010.0086. Epub 2010 Apr 14.

Estimation of measles vaccine efficacy and critical vaccination coverage in a highly vaccinated population

Affiliations

Estimation of measles vaccine efficacy and critical vaccination coverage in a highly vaccinated population

Michiel van Boven et al. J R Soc Interface. .

Abstract

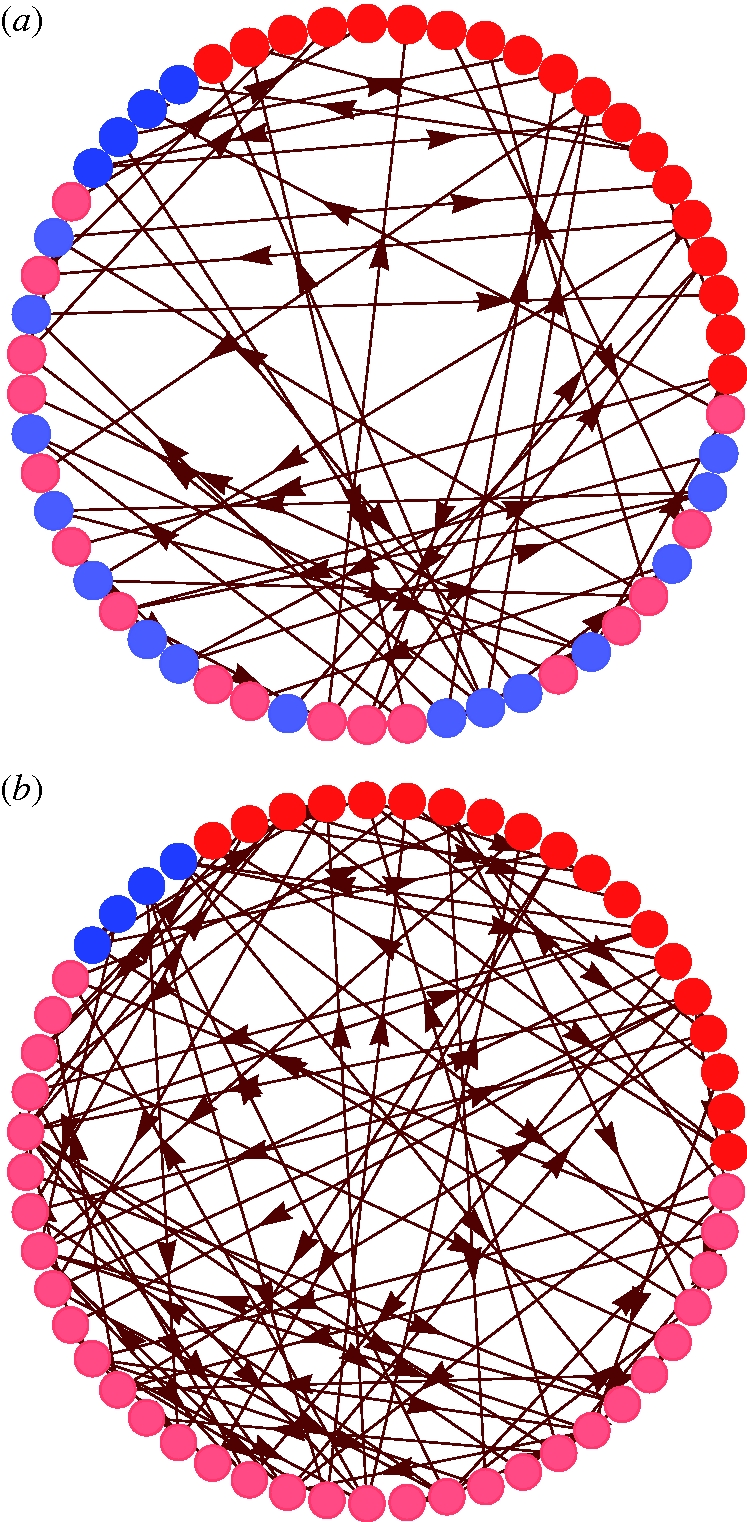
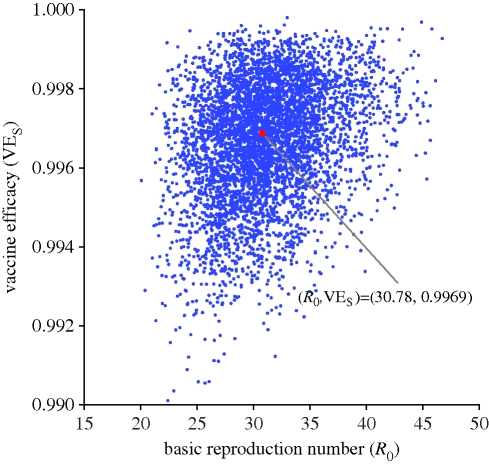
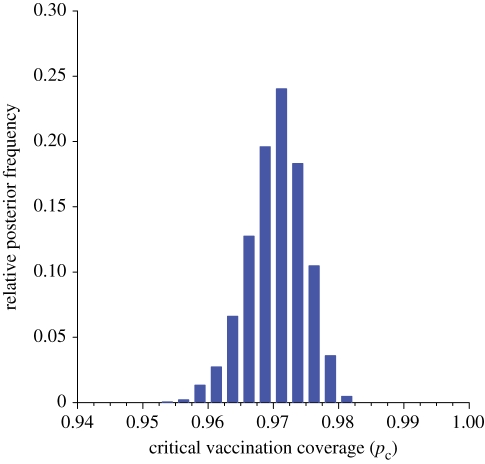
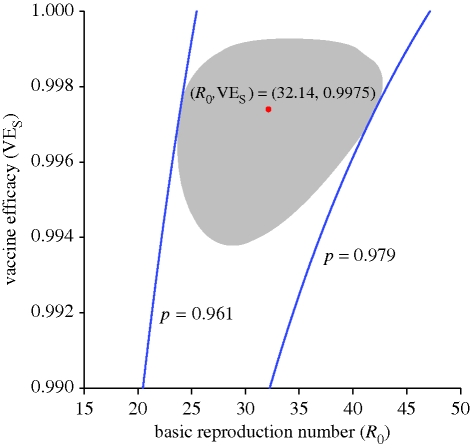
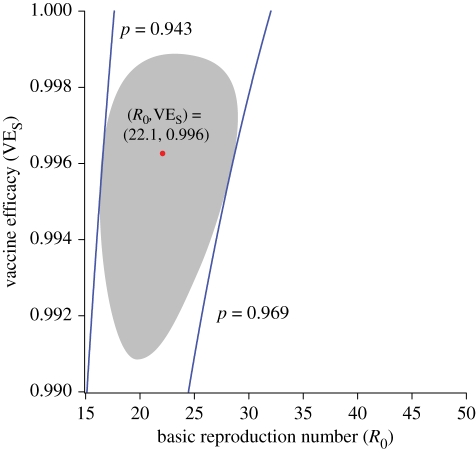
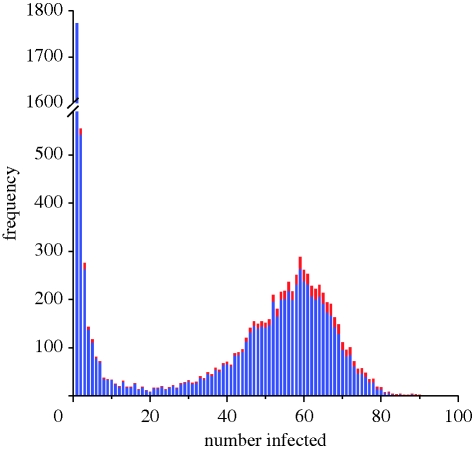
Measles is a highly infectious disease that has been targeted for elimination from four WHO regions. Whether and under which conditions this goal is feasible is, however, uncertain since outbreaks have been documented in populations with high vaccination coverage (more than 90%). Here, we use the example of a large outbreak in a German public school to show how estimates of key epidemiological parameters such as the basic reproduction number (R(0)), vaccine efficacy (VE(S)) and critical vaccination coverage (p(c)) can be obtained from partially observed outbreaks in highly vaccinated populations. Our analyses rely on Bayesian methods of inference based on the final size distribution of outbreak size, and use data which are easily collected. For the German public school the analyses indicate that the basic reproduction number of measles is higher than previously thought (R(0) = 30.8, 95% credible interval: 23.6-40.4), that the vaccine is highly effective in preventing infection (VE(S) = 0.997, 95% credible interval: 0.993-0.999), and that a vaccination coverage in excess of 95 per cent may be necessary to achieve herd immunity (p(c) = 0.971, 95% credible interval: 0.961-0.978). We discuss the implications for measles elimination from highly vaccinated populations.


Figures

Figure 1.
Figure 1.
Initial ((a), cycle 0) and final ((b), cycle 55 000) directed infection graph (digraph). Arrows or edges denote infectious contacts and nodes represent individuals that are infected. Red and blue nodes correspond to individuals that are known to be unvaccinated (red) or vaccinated (blue), while lighter-shaded nodes represent individuals with unknown vaccination status. The colour of these nodes corresponds with the vaccination status of the individuals in the Markov chain.
Figure 2.
Figure 2.
Joint posterior distribution of the basic reproduction number (R0) and vaccine efficacy (VES). The posterior median is indicated by a red dot.
Figure 3.
Figure 3.
Relative posterior frequency distribution of the critical vaccination coverage. The median of the critical vaccination coverage is 0.971 (95% credible interval: 0.961–0.978).
Figure 4.
Figure 4.
Maximum likelihood estimate of the basic reproduction number (R0) and vaccine efficacy (VES), assuming that 51 out of 68 unvaccinated individuals and 4 out of 1120 vaccinated individuals are infected (red dot). The grey area represents the 95% confidence area, and blue lines correspond to the lower and upper bound of the 95% CI of the critical vaccination coverage. The estimate of the critical vaccination coverage based on the maximum likelihood estimates of the basic reproduction number and vaccine efficacy for susceptibility is 0.971.
Figure 5.
Figure 5.
Maximum likelihood estimate of the basic reproduction number (R0) and vaccine efficacy (VES), assuming that 51 out of 83 unvaccinated individuals and 4 out of 1105 vaccinated individuals are infected (red dot). The grey area and blue lines represent the 95% confidence area and bounds of the 95% CI of the critical vaccination coverage, respectively. The estimate of the critical vaccination coverage is 0.958.
Figure 6.
Figure 6.
Frequency distribution of the number of infected individuals in 10 000 simulated outbreaks. In each simulation a set of parameters is drawn from the posterior distribution (basic reproduction number, vaccine efficacy, number of vaccinated individuals). The red parts of the bars refer to the proportion of infected persons that have been vaccinated.

Similar articles

Cited by

References

    1. Anderson R. M., May R. M. 1991. Infectious diseases of humans. Dynamics and control. Oxford, UK: Oxford University Press.
    1. Ball F., O'Neill P. D. 1999. The distribution of general final state random variables for stochastic epidemic models. J. Appl. Probab. 36, 473–491. (10.1239/jap/1032374466) - DOI
    1. Basta N. E., Halloran M. E., Matrajt L., Longini I. M. 2008. Estimating influenza vaccine efficacy from challenge and community-based study data. Am. J. Epidemiol. 168, 1343–1352. (10.1093/aje/kwn259) - DOI - PMC - PubMed
    1. Becker N. G., Britton T. 2004. Estimating vaccine efficacy from small outbreaks. Biometrika 91, 363–382. (10.1093/biomet/91.2.363) - DOI
    1. Becker N. G., Britton T., O'Neill P. D. 2003. Estimating vaccine effects on transmission of infection from household outbreak data. Biometrics 59, 467–475. (10.1111/1541-0420.00056) - DOI - PubMed

Substances