Architecture of inner medullary descending and ascending vasa recta: pathways for countercurrent exchange
- PMID: 20392798
- PMCID: PMC2904161
- DOI: 10.1152/ajprenal.00071.2010
Architecture of inner medullary descending and ascending vasa recta: pathways for countercurrent exchange
Abstract
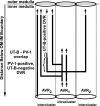
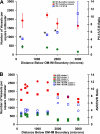
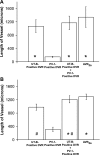
Pathways and densities of descending vasa recta (DVR) and ascending vasa recta (AVR) in the outer zone of the inner medulla (IM) were evaluated to better understand medullary countercurrent exchange. Nearly all urea transporter B (UT-B)-positive DVR, those vessels exhibiting a continuous endothelium, descend with little or no branching exclusively through the intercluster region. All DVR have a terminal fenestrated (PV-1-positive) segment that partially overlaps with the UT-B-positive segment. This fenestrated segment descends a distance equal to approximately 15% of the length of the connecting UT-B-positive segment before formation of the first branch. The onset of branching is indicative of vessel entry into the intracluster region. The number density of UT-B-positive DVR at 3,000 mum below the OM-IM boundary is approximately 60% lower than the density at 400 mum below the OM-IM boundary, a result of DVR joining to fenestrated interconnecting vessels and an overall decline in UT-B expression. AVR that lie in the intercluster region (designated AVR(2)) lie distant from CDs and ascend to the OM-IM boundary with little or no branching. AVR(2a) represent a subcategory of AVR(2) that abut DVR. The mean DVR length (combined UT-B- and PV-1-positive segments) nearly equals the mean AVR(2a) length, implying a degree of overall equivalence in fluid and solute countercurrent exchange may exist. The AVR(2)/DVR ratio is approximately 2:1, and the AVR(2a)/DVR ratio is approximately 1:1; however, the AVR/DVR ratio determined for the full complement of fenestrated vessels is approximately 4:1. The excess fenestrated vessels include vessels of the intracluster region (designated AVR(1)). Countercurrent exchange between vasa recta occurs predominantly in the intercluster region. This architecture supports previous functional estimates of capillary fluid uptake in the renal IM.
Figures


Similar articles
-
Two-compartment model of inner medullary vasculature supports dual modes of vasopressin-regulated inner medullary blood flow.Am J Physiol Renal Physiol. 2010 Jul;299(1):F273-9. doi: 10.1152/ajprenal.00072.2010. Epub 2010 Apr 14. Am J Physiol Renal Physiol. 2010. PMID: 20392799 Free PMC article.
-
Quantitative analysis of functional reconstructions reveals lateral and axial zonation in the renal inner medulla.Am J Physiol Renal Physiol. 2008 Jun;294(6):F1306-14. doi: 10.1152/ajprenal.00068.2008. Epub 2008 Apr 16. Am J Physiol Renal Physiol. 2008. PMID: 18417543
-
Three-dimensional architecture of inner medullary vasa recta.Am J Physiol Renal Physiol. 2006 Jun;290(6):F1355-66. doi: 10.1152/ajprenal.00481.2005. Epub 2005 Dec 27. Am J Physiol Renal Physiol. 2006. PMID: 16380456
-
Renal medullary microcirculation: architecture and exchange.Microcirculation. 1995 Aug;2(2):125-39. doi: 10.3109/10739689509146761. Microcirculation. 1995. PMID: 7497165 Review.
-
The renal medullary microcirculation.Front Biosci. 2000 Jun 1;5:E36-52. doi: 10.2741/edwards. Front Biosci. 2000. PMID: 10833463 Review.
Cited by
-
Architecture of vasa recta in the renal inner medulla of the desert rodent Dipodomys merriami: potential impact on the urine concentrating mechanism.Am J Physiol Regul Integr Comp Physiol. 2012 Oct 1;303(7):R748-56. doi: 10.1152/ajpregu.00300.2012. Epub 2012 Aug 22. Am J Physiol Regul Integr Comp Physiol. 2012. PMID: 22914749 Free PMC article.
-
Tiny clue reveals the general trend: a bibliometric and visualized analysis of renal microcirculation.Ren Fail. 2024 Dec;46(1):2329249. doi: 10.1080/0886022X.2024.2329249. Epub 2024 Mar 14. Ren Fail. 2024. PMID: 38482598 Free PMC article.
-
Axial compartmentation of descending and ascending thin limbs of Henle's loops.Am J Physiol Renal Physiol. 2013 Feb 1;304(3):F308-16. doi: 10.1152/ajprenal.00547.2012. Epub 2012 Nov 28. Am J Physiol Renal Physiol. 2013. PMID: 23195680 Free PMC article.
-
Urine concentrating mechanism: impact of vascular and tubular architecture and a proposed descending limb urea-Na+ cotransporter.Am J Physiol Renal Physiol. 2012 Mar 1;302(5):F591-605. doi: 10.1152/ajprenal.00263.2011. Epub 2011 Nov 16. Am J Physiol Renal Physiol. 2012. PMID: 22088433 Free PMC article.
-
Architecture of the human renal inner medulla and functional implications.Am J Physiol Renal Physiol. 2015 Oct 1;309(7):F627-37. doi: 10.1152/ajprenal.00236.2015. Epub 2015 Aug 19. Am J Physiol Renal Physiol. 2015. PMID: 26290371 Free PMC article.
References
-
- Bankir L, Fischer C, Fischer S, Jukkala K, Specht HC, Kriz W. Adaptation of the rat kidney to altered water intake and urine concentration. Pflügers Arch 412: 42–53, 1988 - PubMed
-
- Bottcher W, Steinhausen M. Microcirculation of the renal papilla of rats under control conditions and after temporary ischemia. Kidney Int 10: S74–S80, 1976 - PubMed
-
- Bulger RE, Trump BF. Fine structure of the rat renal papilla. Am J Anat 118: 685–722, 1966 - PubMed
-
- Cowley AW., Jr Role of the renal medulla in volume and arterial pressure regulation. Am J Physiol Regul Integr Comp Physiol 273: R1–R15, 1997 - PubMed
Publication types
MeSH terms
Substances
Grants and funding
LinkOut - more resources
Full Text Sources

