

Two-compartment model of inner medullary vasculature supports dual modes of vasopressin-regulated inner medullary blood flow
- PMID: 20392799
- PMCID: PMC2904166
- DOI: 10.1152/ajprenal.00072.2010
Two-compartment model of inner medullary vasculature supports dual modes of vasopressin-regulated inner medullary blood flow
Abstract
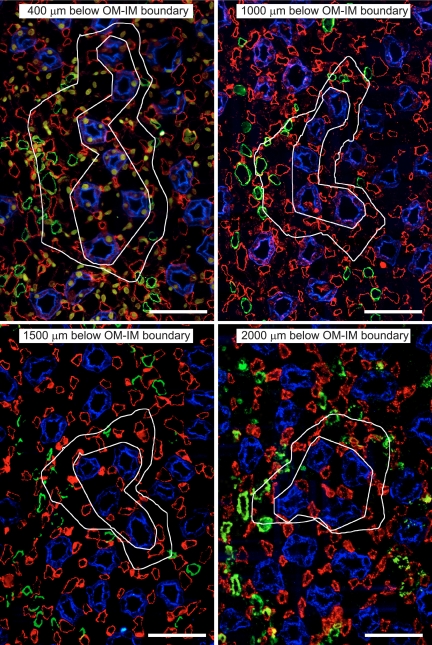
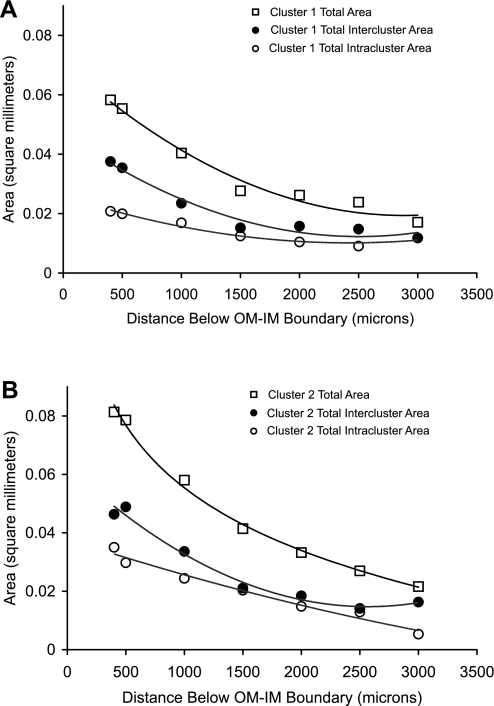
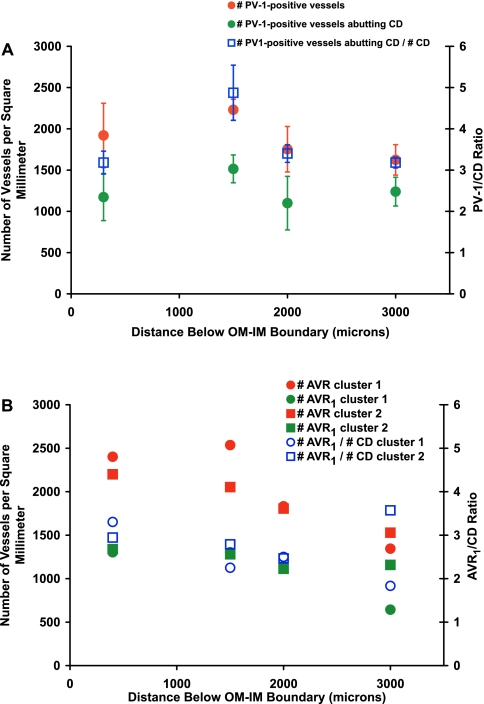
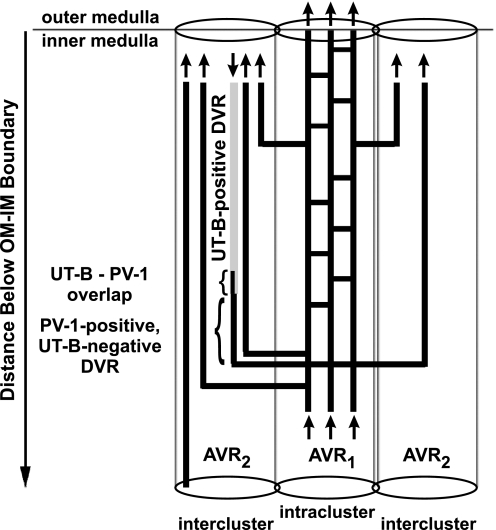
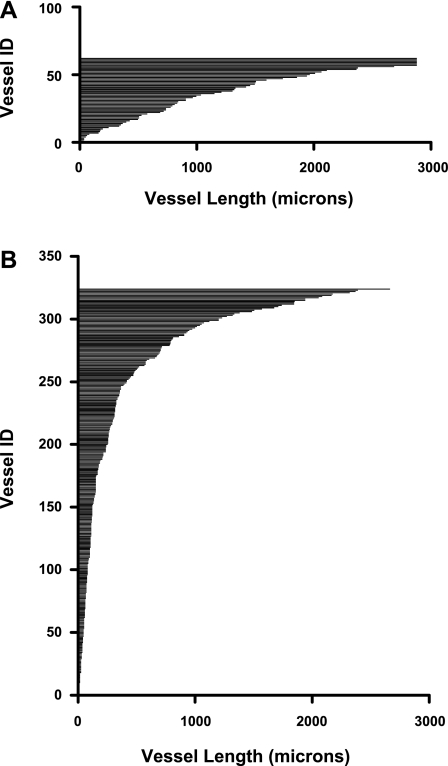
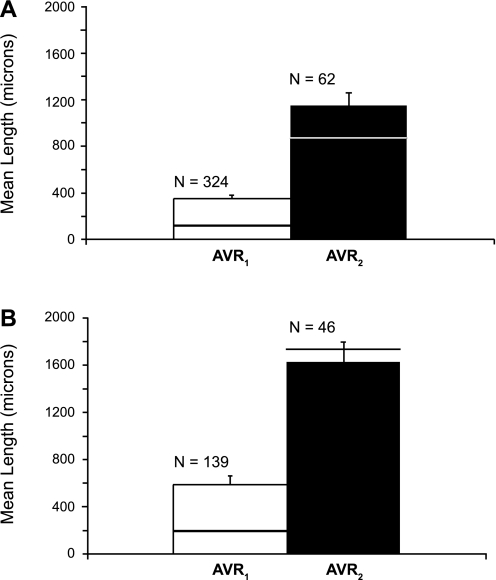
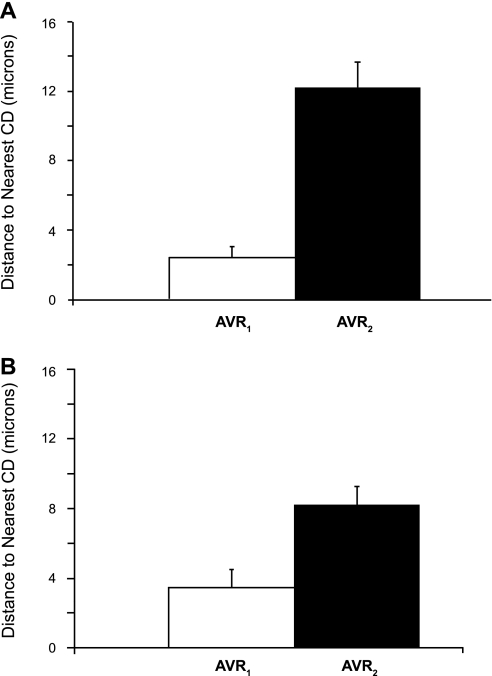
The outer zone of the renal inner medulla (IM) is spatially partitioned into two distinct interstitial compartments in the transverse dimension. In one compartment (the intercluster region), collecting ducts (CDs) are absent and vascular bundles are present. Ascending vasa recta (AVR) that lie within and ascend through the intercluster region (intercluster AVR are designated AVR(2)) participate with descending vasa recta (DVR) in classic countercurrent exchange. Direct evidence from former studies suggests that vasopressin binds to V1 receptors on smooth muscle-like pericytes that regulate vessel diameter and blood flow rate in DVR in this compartment. In a second transverse compartment (the intracluster region), DVR are absent and CDs and AVR are present. Many AVR of the intracluster compartment exhibit multiple branching, with formation of many short interconnecting segments (intracluster AVR are designated AVR(1)). AVR(1) are linked together and connect intercluster DVR to AVR(2) by way of sparse networks. Vasopressin V2 receptors regulate multiple fluid and solute transport pathways in CDs in the intracluster compartment. Reabsorbate from IMCDs, ascending thin limbs, and prebend segments passes into AVR(1) and is conveyed either upward toward DVR and AVR(2) of the intercluster region, or is retained within the intracluster region and is conveyed toward higher levels of the intracluster region. Thus variable rates of fluid reabsorption by CDs potentially lead to variable blood flow rates in either compartment. Net flow between the two transverse compartments would be dependent on the degree of structural and functional coupling between intracluster vessels and intercluster vessels. In the outermost IM, AVR(1) pass directly from the IM to the outer medulla, bypassing vascular bundles, the primary blood outflow route. Therefore, two defined vascular pathways exist for fluid outflow from the IM. Compartmental partitioning of V1 and V2 receptors may underlie vasopressin-regulated functional compartmentation of IM blood flow.
Figures

Similar articles
-
Architecture of inner medullary descending and ascending vasa recta: pathways for countercurrent exchange.Am J Physiol Renal Physiol. 2010 Jul;299(1):F265-72. doi: 10.1152/ajprenal.00071.2010. Epub 2010 Apr 14. Am J Physiol Renal Physiol. 2010. PMID: 20392798 Free PMC article.
-
Quantitative analysis of functional reconstructions reveals lateral and axial zonation in the renal inner medulla.Am J Physiol Renal Physiol. 2008 Jun;294(6):F1306-14. doi: 10.1152/ajprenal.00068.2008. Epub 2008 Apr 16. Am J Physiol Renal Physiol. 2008. PMID: 18417543
-
Architecture of vasa recta in the renal inner medulla of the desert rodent Dipodomys merriami: potential impact on the urine concentrating mechanism.Am J Physiol Regul Integr Comp Physiol. 2012 Oct 1;303(7):R748-56. doi: 10.1152/ajpregu.00300.2012. Epub 2012 Aug 22. Am J Physiol Regul Integr Comp Physiol. 2012. PMID: 22914749 Free PMC article.
-
The renal medullary microcirculation.Front Biosci. 2000 Jun 1;5:E36-52. doi: 10.2741/edwards. Front Biosci. 2000. PMID: 10833463 Review.
-
Renal medullary microcirculation: architecture and exchange.Microcirculation. 1995 Aug;2(2):125-39. doi: 10.3109/10739689509146761. Microcirculation. 1995. PMID: 7497165 Review.
Cited by
-
Architecture of kangaroo rat inner medulla: segmentation of descending thin limb of Henle's loop.Am J Physiol Regul Integr Comp Physiol. 2012 Mar 15;302(6):R720-6. doi: 10.1152/ajpregu.00549.2011. Epub 2012 Jan 11. Am J Physiol Regul Integr Comp Physiol. 2012. PMID: 22237592 Free PMC article.
-
Comparative physiology and architecture associated with the mammalian urine concentrating mechanism: role of inner medullary water and urea transport pathways in the rodent medulla.Am J Physiol Regul Integr Comp Physiol. 2013 Apr 1;304(7):R488-503. doi: 10.1152/ajpregu.00456.2012. Epub 2013 Jan 30. Am J Physiol Regul Integr Comp Physiol. 2013. PMID: 23364530 Free PMC article. Review.
-
Urine-concentrating mechanism in the inner medulla: function of the thin limbs of the loops of Henle.Clin J Am Soc Nephrol. 2014 Oct 7;9(10):1781-9. doi: 10.2215/CJN.08750812. Epub 2013 Aug 1. Clin J Am Soc Nephrol. 2014. PMID: 23908457 Free PMC article.
-
Urine concentrating mechanism: impact of vascular and tubular architecture and a proposed descending limb urea-Na+ cotransporter.Am J Physiol Renal Physiol. 2012 Mar 1;302(5):F591-605. doi: 10.1152/ajprenal.00263.2011. Epub 2011 Nov 16. Am J Physiol Renal Physiol. 2012. PMID: 22088433 Free PMC article.
-
Axial compartmentation of descending and ascending thin limbs of Henle's loops.Am J Physiol Renal Physiol. 2013 Feb 1;304(3):F308-16. doi: 10.1152/ajprenal.00547.2012. Epub 2012 Nov 28. Am J Physiol Renal Physiol. 2013. PMID: 23195680 Free PMC article.
References
-
- Bankir L, Fischer C, Fischer S, Jukkala K, Specht HC, Kriz W. Adaptation of the rat kidney to altered water intake and urine concentration. Pflügers Arch 412: 42–53, 1988 - PubMed
-
- Cowley AW., Jr Role of the renal medulla in volume and arterial pressure regulation. Am J Physiol Regul Integr Comp Physiol 273: R1–R15, 1997 - PubMed
-
- Cowley AW., Jr Control of the renal medullary circulation by vasopressin V1 and V2 receptors in the rat. Exp Physiol 85S: 223S–231S2000 - PubMed
-
- Han JS, Thompson KA, Chou CL, Knepper MA. Experimental tests of three-dimensional model of urinary concentrating mechanism. J Am Soc Nephrol 2: 1677–1688, 1992 - PubMed
-
- Jamison RL, Kriz W. Urinary Concentrating Mechanism New York: Oxford University Press, 1982
Publication types
MeSH terms
Substances
Grants and funding
LinkOut - more resources
Full Text Sources