. 2010 Jul;299(1):F187-98.
doi: 10.1152/ajprenal.00607.2009. Epub 2010 Apr 14.

Expression of ammonia transporter family members, Rh B glycoprotein and Rh C glycoprotein, in the developing rat kidney

Affiliations

Expression of ammonia transporter family members, Rh B glycoprotein and Rh C glycoprotein, in the developing rat kidney

Ki-Hwan Han et al. Am J Physiol Renal Physiol. 2010 Jul.

Abstract

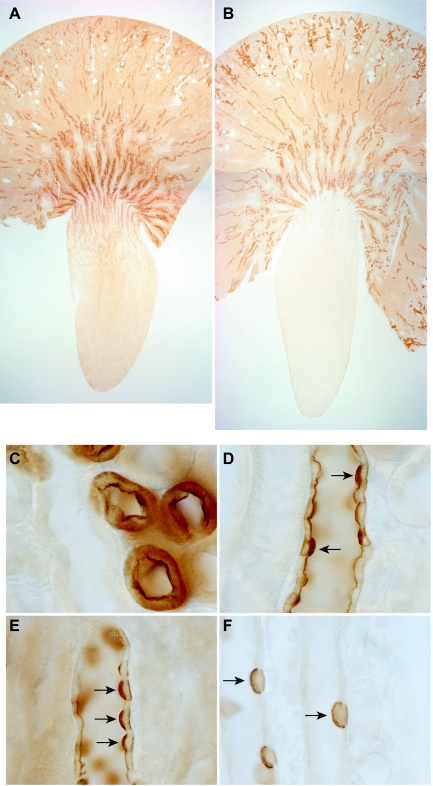
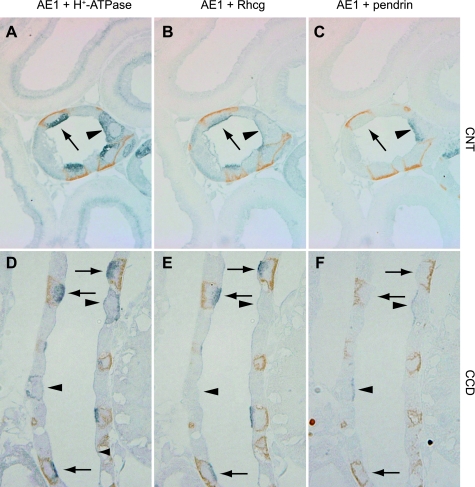
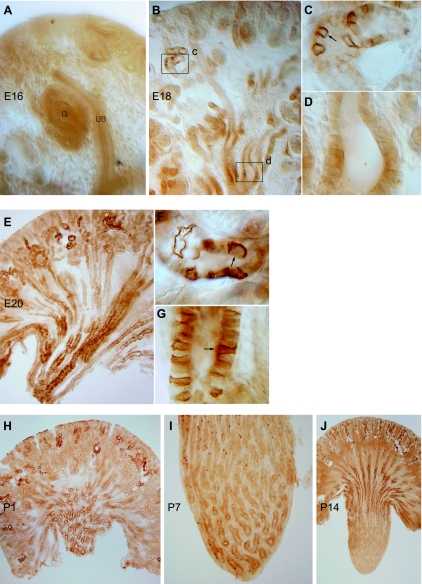
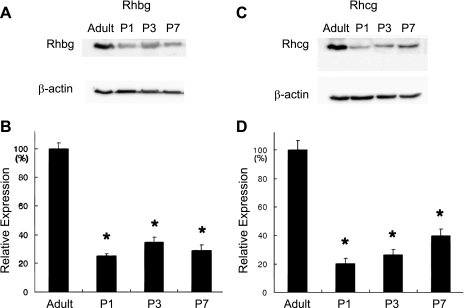
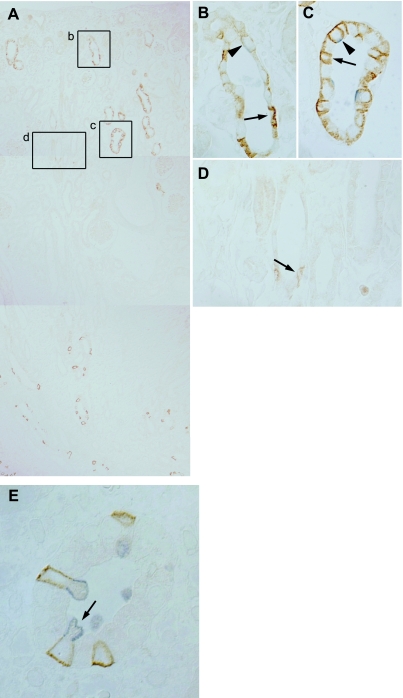
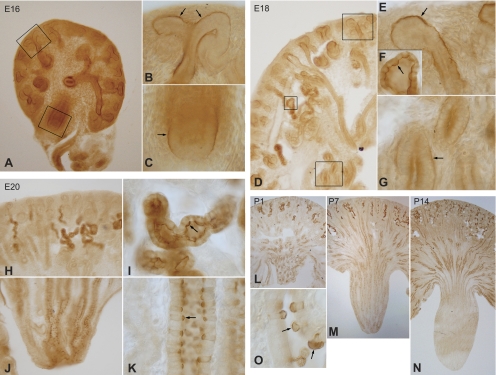
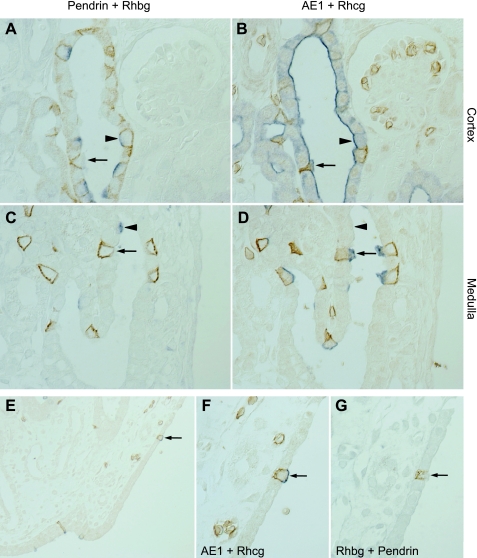
Ammonia metabolism is a primary component of acid-base homeostasis but is incompletely developed at time of birth. Rh B glycoprotein (Rhbg) and Rh C glycoprotein (Rhcg) are recently recognized ammonia transporter family members expressed in the mammalian kidney. This study's purpose was to establish the expression and localization of Rhbg and Rhcg during kidney development. We examined kidneys from fetal days 16 (E16), 18 (E18), and 20 (E20), and from the first 21 days of postnatal development. Rhbg was expressed initially at E18, with expression only in the connecting tubule (CNT); at E20, Rhbg was expressed in both the CNT and the medullary collecting duct (MCD). In contrast, Rhcg was first expressed at E16 with basal expression in the ureteric bud; at E18, it was expressed in a subset of CNT cells with an apical pattern, followed by apical and basolateral expression in the MCD at E20. In the cortex, Rhbg and Rhcg expression increased in the CNT before expression in the cortical collecting duct during fetal development. In the MCD, both Rhbg and Rhcg expression was initially in cells in the papillary tip, with gradual removal from the tip during the late fetal period and transition during the early neonatal period to an adult pattern with predominant expression in the outer MCD and only rare expression in cells in the initial inner MCD. Double-labeling with intercalated cell-specific markers identified that Rhbg and Rhcg were expressed initially in CNT cells, CNT A-type intercalated cells and non-A, non-B intercalated cells, and in MCD A-type intercalated cells. We conclude that expression of Rhbg and Rhcg parallels intercalated cell development and that immature Rhbg and Rhcg expression at birth contributes to incomplete ammonia excretion capacity.


Figures

Fig. 1.
Fig. 1.
Rh B glycoprotein (Rhbg) and Rh C glycoprotein (Rhcg) expression in adult rat kidney. A: low-power micrograph of Rhbg immunolabel expression in adult rat kidney. The heaviest expression is in inner stripe of outer medulla, with intermediate expression in the cortex and in intercalated cells in the inner medullary collecting duct (IMCD). B: low-power micrograph of Rhcg immunolabel expression in adult kidney. The regional pattern of Rhcg expression is similar to that observed for Rhbg in A. C: intense Rhcg immunolabel expression in high-power micrograph of the connecting tubule (CNT). D: heterogeneous Rhcg expression in the cortical collecting duct (CCD). Intense Rhcg expression is present in A-type intercalated cells (arrows), with less intense expression in principal cells. E: high-power micrograph of outer medullary collecting duct (OMCD) that demonstrates intense Rhcg expression in A-type intercalated cells (arrows) and low-level expression in principal cells. F: high-power micrograph from the IMCD that demonstrates Rhcg expression only in A-type intercalated cells in the IMCD.
Fig. 2.
Fig. 2.
Colocalization of Rhcg with intercalated cell-specific markers. AC: serial sections of adult rat CNT colabeled for AE1 (brown) and H+-ATPase (blue) in A, AE1 (brown) and Rhcg (blue) in B, and AE1 (brown) and pendrin (blue) in C. A-type intercalated cells, identified by apical H+-ATPase, basolateral AE1, and the absence of pendrin immunolabel, express intense Rhcg immunolabel (arrow). Non-A, non-B intercalated cells, identified by apical H+-ATPase, absence of basolateral AE1, and the presence of apical pendrin (arrowhead), express Rhcg immunolabel. DF: similar studies in the CCD. Again, A-type intercalated cells identified by apical H+-ATPase, basolateral AE1, and the absence of apical pendrin express Rhcg immunolabel (arrows). In contrast to the non-A, non-B intercalated cell, B-type intercalated cells, identified by basolateral H+-ATPase and apical pendrin immunolabel (arrowheads), do not express detectable Rhcg immunolabel.
Fig. 3.
Fig. 3.
Expression of Rhbg in the developing kidney. A: at embryonic day 16 (E16), detectable Rhbg immunolabel was not expressed in developing glomeruli (G), ureteric bud (UB), or interstitium. BD: Rhbg expression at E18. B: low-power micrograph of Rhbg immunolabel in the E18 rat kidney. Expression is present in a subset of convoluted tubule cells in the cortex, primarily in the corticomedullary junction region. C: high-power micrograph of cortex showing basolateral Rhbg expression in a subset of connecting segment cells. D: high-power micrograph of medullary collecting duct (MCD) demonstrating that specific Rhbg immunolabel is not present at E18. EG: Rhbg in the E20 kidney. Rhbg expression in the cortex is predominantly in the inner cortical region in CNT segments and is increased relative to E18. Medullary Rhbg expression is now present and is greatest in the distal medulla. F: high-power micrograph demonstrating basolateral Rhbg immunolabel in a subset of connecting segment cells (arrow). G: simultaneous intense basolateral Rhbg immunolabel in a subset of MCD cells. The distinct basolateral Rhbg expression present in many, but not all, MCD cells is consistent with differential expression in intercalated cells and principal cells. H: low-power micrograph at postnatal day 1 (P1). Rhbg is expressed at increasing levels in connecting segments in the cortex and in collecting duct segments in the medulla. CCD segments do not express significant Rhbg immunolabel. In the medulla, Rhbg expression is greatest in the distal MCD, with relatively less expression in the MCD adjacent to the corticomedullary junction. I: high-power micrograph of the medulla of the P7 kidney. There is the beginning of the disappearance of Rhbg immunolabel from the distal MCD and increased expression in a subset of cells in the MCD closer to the corticomedullary junction. J: Rhbg expression in the P14 kidney. There is a further increase in Rhbg immunolabel in the cortex, almost complete absence of Rhbg-expressing cells in the distal MCD, and increased expression in more proximal regions of the MCD.
Fig. 4.
Fig. 4.
Rhbg and Rhcg protein expression in the postnatal kidney. A: immunoblot analysis of Rhbg expression in the adult kidney and in the P1, P3, and P7 kidney. β-Actin is used as a loading control. B: quantitative analysis of Rhbg expression relative to β-actin expression. Rhbg expression is significantly less in the postnatal kidney at each time point than in the adult kidney. Results are shown as expression relative to mean adult kidney expression (100%). C: immunoblot analysis of Rhcg expression in adult kidney and in P1, P3, and P7 kidney. β-Actin is again used as a loading control. D: quantitative analysis of Rhcg expression relative to β-actin expression. Results are shown as expression relative to mean adult kidney expression (100%). Rhcg expression is significantly less in the postnatal kidney at each time point than in the adult kidney. *P < 0.05 by Student's 2-tailed t-test; n = 3 in each group.
Fig. 5.
Fig. 5.
Double-immunolabeling, Rhbg and pendrin, at P4. A: composite micrograph showing entire kidney, from cortex to medullary tip. Rhbg immunolabel is present in a subset of cells in the cortex and the medullary tip, and is absent from intermediate regions. B: high-power micrograph of inset b in A showing convoluted epithelial tubule structure from the outer cortex. Cells with intense basolateral Rhbg immunolabel (arrow) do not express detectable pendrin and are identified as A-type intercalated cells. Pendrin-positive cells (arrowhead) express very low levels of basolateral Rhbg and are identified as B-type intercalated cells. C: high-power micrograph of inset c in A showing CNT closer to the corticomedullary junction that demonstrates that both A-type intercalated cells, with intense basolateral Rhbg but not apical pendrin (arrow) immunolabel, and non-A, non-B cell cells, with apical pendrin and basolateral Rhbg immunolabel (arrowhead), are present. D: high-power micrograph of inset d in A showing collecting duct from the deep cortex showing that only rare A-type intercalated cells, with basolateral Rhbg and without detectable pendrin immunolabel (arrow), are present. Rhbg immunolabel intensity is low, consistent with an immature phenotype of intercalated cells at this time point. E: micrograph from the deep medulla. Cells with intense basolateral Rhbg immunolabel (brown) express apical H+-ATPase immunolabel (blue), identifying these cells as A-type intercalated cells (arrow).
Fig. 6.
Fig. 6.
Rhcg expression in developing rat kidney. A: low-power micrograph of Rhcg immunolabel in the E16 kidney. Distinct Rhcg immunolabel is present in both cortical and medullary structures. B: basal Rhcg immunolabel that is concentrated in collecting duct segments at sites of branching morphogenesis (arrow). C: basolateral Rhcg immunolabel (arrow) in the medulla of the E16 kidney. Apical Rhcg immunolabel is not detectable in either cortical or medullary sites at E16. D: low-power micrograph of E18 kidney. Rhcg immunolabel is present in both the cortex and the medulla. E: high-power micrograph of a CCD segment. Basolateral, but not apical, Rhcg immunolabel is present. F: apical Rhcg immunolabel in CNT cells (arrow), the first site of apical Rhcg expression. G: MCD at E18 that demonstrates continued basal Rhcg immunolabel without significant apical Rhcg expression. H: low-power micrograph of cortex of E20 kidney. Intense Rhcg immunolabel is present in a subpopulation of convoluted tubule structures, but not in collecting duct segments. I: high-power micrograph of CNT demonstrating strong apical Rhcg immunolabel (arrow). J: low-power micrograph of medulla at E20. Numerous Rhcg-positive cells are present, particularly in the distal MCD. K: high-power micrograph of MCD. Intense apical Rhcg immunolabel with less-intense basolateral Rhcg immunolabel are present (arrow). L: low-power micrograph of Rhcg expression at P1. In the cortex, there is continued preferential expression of Rhcg in convoluted tubule structures, but absence of Rhcg expression in CCD segments. In the medulla, the predominance of Rhcg expression is in the distal MCD. M: low-power micrograph of Rhcg expression at P7. There is continued development of Rhcg expression in convoluted tubule segments and the onset of expression in the CCD. Rhcg expression in the CCD tends to be more intense in the deep CCD, closer to the corticomedullary junction. In the medulla, there are fewer Rhcg-expressing cells in the tip of the MCD, with a relative increase in numbers at the base of the papilla and the appearance of labeled cells in the OMCD near the corticomedullary junction. N: low-power micrograph at P14. In the cortex there is a nearly adult phenotype of Rhcg expression, with Rhcg present in both convoluted tubule cells and in CCD. In the medulla, there is near complete removal of Rhcg-expressing cells from the papilla, with rare cells present in the base of the papilla and greater expression in the outer medulla. O: region of the papillary surface epithelium at P7. Cells with intense apical Rhcg immunolabel are in the process of being extruded from the basement membrane into the papillary space, a known mechanism of intercalated cell deletion during development.
Fig. 7.
Fig. 7.
Double-immunolabel of Rhbg with pendrin and Rhcg with AE1 in serial sections. In the cortex (A and B), Rhbg-positive, pendrin-negative cells (arrow, A) expressed basolateral AE1 and apical Rhcg immunolabel (arrow, B), identifying these cells as A-type intercalated cells. Rhbg-positive, pendrin-positive cells (arrowhead, A) were Rhcg-positive and AE1-negative (arrowhead, B) in serial sections. Thus these are non-A, non-B cell cells. In the medulla (C and D), pendrin-positive cells in general did not express detectable Rhbg immunolabel (arrowhead, C), nor did they express detectable Rhcg or AE1 immunolabel (arrowhead, D). These cells are identified as B-type intercalated cells. Rhbg-positive cells were pendrin negative (arrow, C) and expressed apical Rhcg and basolateral AE1 immunolabel (arrow, D). Thus these are A-type intercalated cells. EG: Rh glycoprotein expression in the papillary surface epithelium of the P4 kidney. E: low-power micrograph demonstrating Rhcg (blue) and AE1 (brown) immunolabel in occasional cells in papillary surface epithelium. F: high-power micrograph of A-type intercalated cell, identified by expression of both Rhcg and AE1. G: double-immunolabel of serial section for pendrin (blue, not detectable) and Rhbg (brown) in the same cell as in F.

Similar articles

Cited by

References

    1. Benyajati S, Goldstein L. Renal glutaminase adaptation and ammonia excretion in infant rats. Am J Physiol 228: 693–698, 1975 - PubMed
    1. Biver S, Belge H, Bourgeois S, Van Vooren P, Nowik M, Scohy S, Houillier P, Szpirer J, Szpirer C, Wagner CA, Devuyst O, Marini AM. A role for Rhesus factor Rhcg in renal ammonium excretion and male fertility. Nature 456: 339–343, 2008 - PubMed
    1. Blomqvist SR, Vidarsson H, Fitzgerald S, Johansson BR, Ollerstam A, Brown R, Persson AE, Bergstrom GG, Enerback S. Distal renal tubular acidosis in mice that lack the forkhead transcription factor Foxi1. J Clin Invest 113: 1560–1570, 2004 - PMC - PubMed
    1. Bonnici B, Wagner CA. Postnatal expression of transport proteins involved in acid-base transport in mouse kidney. Pflügers Arch 448: 16–28, 2004 - PubMed
    1. Cort JH, McCance RA. The renal response of puppies to an acidosis. J Physiol 124: 358–369, 1954 - PMC - PubMed

Publication types

LinkOut - more resources