Review
. 2010 Jun;62(2):199-236.
doi: 10.1124/pr.109.002469. Epub 2010 Apr 14.

Insulin-like growth factor-I regulation of immune function: a potential therapeutic target in autoimmune diseases?

Affiliations
Review

Insulin-like growth factor-I regulation of immune function: a potential therapeutic target in autoimmune diseases?

Terry J Smith. Pharmacol Rev. 2010 Jun.

Abstract

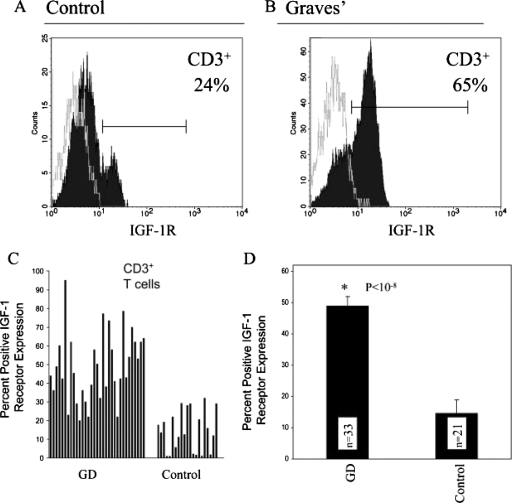
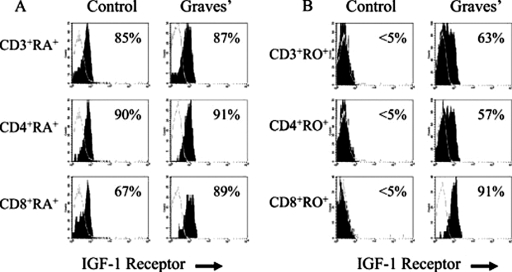
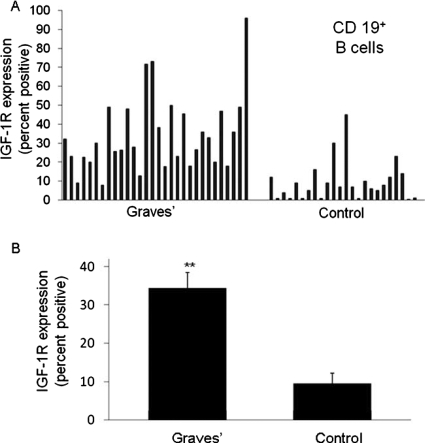
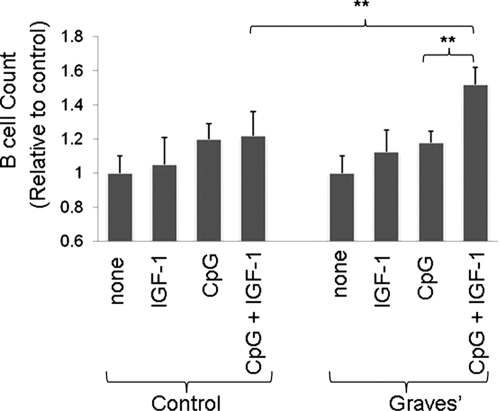
This topically limited review explores the relationship between the immune system and insulin-like growth factors (IGF-I and IGF-II) and the proteins through which they act, including IGF-I receptor (IGF-IR) and the IGF-I binding proteins. The IGF/IGF-IR pathway plays important and diverse roles in tissue development and function. It regulates cell cycle progression, apoptosis, and the translation of proteins. Many of the consequences ascribed to IGF-IR activation result from its association with several accessory proteins that are either identical or closely related to those involved in insulin receptor signaling. Relatively recent awareness that IGF-I and IGF-IR regulate immune function has cast this pathway in an unexpected light; it may represent an important switch governing the quality and amplitude of immune responses. IGF-I/IGF-IR signaling may also participate in the pathogenesis of autoimmune diseases, although its relationship with these processes seems complex and relatively unexplored. On the one hand, IGF-I seems to protect experimental animals from developing insulin-deficient diabetes mellitus. In contrast, activating antibodies directed at IGF-IR have been detected in patients with Graves' disease, where the receptor is overexpressed by multiple cell types. The frequency of IGF-IR+ B and T cells is substantially increased in patients with that disease. Potential involvement of IGF-I and IGF-IR in the pathogenesis of autoimmune diseases suggests that this pathway might constitute an attractive therapeutic target. IGF-IR has been targeted in efforts directed toward drug development for cancer, employing both small-molecule and monoclonal antibody approaches. These have been generally well-tolerated. Recognizing the broader role of IGF-IR in regulating both normal and pathological immune responses may offer important opportunities for therapeutic intervention in several allied diseases that have proven particularly difficult to treat.


Figures

Fig. 1.
Fig. 1.
Structures of the IGF-I receptor and its ligand. Three-dimensional structure of large domain 1 (L1)–Cys-rich (CR)-L2 domain of IGF-IR determined by X-ray crystallography. An extended bilobed structure (40 × 48 × 105 Å) comprises the two globular L-domains with a new type of right-handed β-helix fold that flanks the CR domain. They seem to be part of the leucine-rich-repeat superfamily. Although L1 (residues 1–15; green) contacts the CR domain (blue) along its length, there is minimal contact with L2 (residues 300–460; orange). Flexibility between CR domain and L2 could affect ligand binding. A −30-Å diameter cavity represents a potential binding pocket. The amino acids that have been determined by alanine-scanning mutagenesis to be important for ligand binding are shown in yellow as van der Waals spheres. Three-dimensional IGF-I structure is based on the X-ray coordinates from Brzozowski et al. (2002). The backbone is shown in blue. [Reproduced from De Meyts P and Whittaker J (2002) Structural biology of insulin and IGF1 receptors: implications for drug design. Nat Rev Drug Discov 1:769–783. Copyright © 2002 Nature Publishing Group. Used with permission.]
Fig. 2.
Fig. 2.
Schematic of the IGF-IR dimer demonstrating the distribution of domains across α and β chains and the location of α-β disulfides and α-α dimer disulfide bonds. [Adapted from Clemmons DR (2001) IGF-I receptor-mediated signal transduction, in Targets for Growth Hormone and IGF-I Action (Bouillon R ed), pp 17–28, Bioscientifica Ltd., Bristol, UK. Copyright © 2001 Bioscientifica Ltd. Used with permission.]
Fig. 3.
Fig. 3.
Major components of IGF-R-linked signaling pathways. IRS-1 represents a central docking protein involved in the activation of MAP kinase and PI3 kinase pathways. Like IRS, Shc can be phosphorylated directly as a consequence of the receptor kinase. GF-R, growth factor receptor; MEK-K, MEK kinase; p, phosphorylation; Sos, Son of Sevenless. [Reprinted from Clemmons DR (2001) IGF-1 receptor-mediated signal transduction, in Targets for Growth Hormone and IGF-1 Action (Bouillon R ed), pp 17–28, Bioscientifica Ltd., Bristol, UK. Copyright © 2001 Bioscientifica Ltd. Used with permission.]
Fig. 4.
Fig. 4.
The effects of IL-1β, IGF-I, and GD-IgG, without or with anti-IGF-IR antibody 1H7, on T-cell chemotactic activity (A) and IL-16 (■) and the RANTES (□) protein expression (B) in fibroblasts from donors with GD. Cultures were treated with IL-1β (10 ng/ml), IGF-I (10 nM), and GD IgG (100 ng/ml), without or with antibody 1H7 (5 μg/ml) for 24 h, then the media were subjected to T-cell migration assays or specific enzyme-linked immunosorbent assays. Samples used for chemotaxis analysis were then treated with no Ab (■) or anti-IL-16 (clone 14.1, 5 μg/ml; □) or anti-RANTES (5 μg/ml; ▨) neutralizing antibodies, as indicated. Migratory data are expressed as a percentage compared with unstimulated (random) migration, which is designated 100%. *, statistically different migration in the presence of neutralizing antibodies (A) or protein production (B) at the 5% confidence level. [Reprinted from Pritchard J, Han R, Horst N, Cruikshank WW, and Smith TJ (2003) Immunoglobulin activation of T cell chemoattractant expression in fibroblasts from patients with Graves' disease is mediated through the insulin-like growth factor I receptor pathway. J Immunol 170:6348–6354. Copyright © 2003 The American Association of Immunologists, Inc. Used with permission.]
Fig. 5.
Fig. 5.
Expression of a DN mutant IGF-IR in GD fibroblasts can block the effects of GD-IgG on T-cell chemoattractant activity (A) and IL-16 (■) and RANTES (□) protein expression (B). Confluent cultures of fibroblasts from a patient with GD were transiently transfected with a plasmid containing the dominant-negative mutant IGF-IR designated 486/STOP or with empty vector (as control). Cultures were then treated with GD-IgG (100 ng/ml) or nothing (control) for 24 h. Media were collected and analyzed for T-cell migratory activity without (■) or with either anti-IL-16 (□) or anti-RANTES (▨) neutralizing antibodies (5 μg/ml) or for IL-16 and RANTES protein expression. The migratory data are expressed as a percentage compared with unstimulated (random) migration, which is designated 100%. *, statistically different migration in the presence of neutralizing antibodies (A) or protein production (B) at the 5% confidence level. [Reprinted from Pritchard J, Han R, Horst N, Cruikshank WW, and Smith TJ (2003) Immunoglobulin activation of T cell chemoattractant expression in fibroblasts from patients with Graves' disease is mediated through the insulin-like growth factor I receptor pathway. J Immunol 170:6348–6354. Copyright © 2003 The American Association of Immunologists, Inc. Used with permission.]
Fig. 6.
Fig. 6.
Increased fraction of peripheral blood T cells from patients with GD display IGF-IR compared with those from control donors. Peripheral blood mononuclear cells were stained with anti-CD3 and IGF-IR antibodies and subjected to multiparameter flow cytometry. A and B, the open histograms represent staining with isotype control antibodies. Data are derived from single, representative samples from each source. C, fraction of IGF-IR+ CD3+ T cells from individual patients with GD and control donors. D, analysis of IGF-IR display in T cells from the aggregate of multiple patients with GD and control donors; 48 ± 4% GD T cells (n = 33) display IGF-IR compared with 15 ± 3% control T cells (n = 21; p < 10−8). Data are expressed as mean ± S.E. [Reprinted from Douglas RS, Gianoukakis AG, Kamat S, and Smith TJ (2007) Aberrant expression of the IGF-1 receptor by T cells from patients with Graves' disease may carry functional consequences for disease pathogenesis. J Immunol 178:3281–3287. Copyright © 2007 The American Association of Immunologists, Inc. Used with permission.]
Fig. 7.
Fig. 7.
Disproportionate IGF-IR+CD45RO+ memory T cells from patients with GD. The fraction of CD3+, CD4+, and CD8+ T lymphocytes expressing IGF-IR was determined using multiparameter flow cytometry by gating on populations of CD3+, CD4+, or CD8+, CD45RA+, or CD45RO+ T cells and is represented as a histogram (filled) compared with isotype controls (open). A, naive CD45RA+ lymphocytes from a patient with GD and a control donor demonstrate a similar, frequent display of IGF-IR. B, the fraction of memory CD45RO+ lymphocytes expressing IGF-IR is dramatically greater in lymphocytes from a patient with GD compared with control. GD CD8+CD45RO+ T lymphocytes uniformly express IGF-IR, compared with infrequent control CD8+CD45RO+ cells. T-cell expression of IGF-IR was representative of our aggregate observations. [Reprinted from Douglas RS, Gianoukakis AG, Kamat S, and Smith TJ (2007) Aberrant expression of the IGF-1 receptor by T cells from patients with Graves' disease may carry functional consequences for disease pathogenesis. J Immunol 178:3281–3287. Copyright © 2007 The American Association of Immunologists, Inc. Used with permission.]
Fig. 8.
Fig. 8.
A disproportionate fraction of peripheral blood B cells from 30 patients with GD express IGF-IR compared with that found in 24 control donors. A, individual data sets demonstrating fractional IGF-IR+ B cells. B, analysis of IGF-IR display in B cells as an aggregate of multiple patients with GD versus control donors [34 ± 4% IGF-IR+ B cells (mean ± S.E., n = 30) versus 9 ± 3% IGF-IR+ control B cells (n = 24)]. Data are expressed as means ± S.E. (**, p < 10−6). [Reprinted from Douglas RS, Naik V, Hwang CJ, Afifiyan NF, Gianoukakis AG, Sand D, Kamat S, and Smith TJ (2008) B cells from patients with Graves' disease aberrantly express the IGF-1 receptor: implications for disease pathogenesis. J Immunol 181:5768–5774. Copyright © 2008 The American Association of Immunologists, Inc. Used with permission.]
Fig. 9.
Fig. 9.
IGF-I potentiates B-cell expansion when added together with a concentration of CpG, yielding a submaximal response. Number of B cells was assessed after 5 days in culture with CpG (2 μg/ml) and IGF-I (10 nM) as single agents or in combination. Data were derived from five independent experiments (mean ± S.E.; **, p < 0.02). [Reprinted from Douglas RS, Naik V, Hwang CJ, Afifiyan NF, Gianoukakis AG, Sand D, Kamat S, and Smith TJ (2008) B cells from patients with Graves' disease aberrantly express the IGF-1 receptor: implications for disease pathogenesis. J Immunol 181:5768–5774. Copyright © 2008 The American Association of Immunologists, Inc. Used with permission.]
Fig. 10.
Fig. 10.
Analysis using immunohistochemistry of insulin expression by islets from N4 CD-1 mice. a–f, pancreata from 2-month-old, untreated nontransgenic (Con) (a) and transgenic (Tg) (d) mice, nontranstgenic (b) and transgenic (e) mice treated with streptozotocin (STZ) for 2 weeks, whereas other nontransgenic (c) and transgenic (f) mice were treated for 4 months. Magnification, 400×. g–j, analysis of 6-month-old, untreated nontransgenic (g) and transgenic (h) mice and nontransgenic (i) and transgenic (j) mice treated for 4 months with STZ. Magnification, 40×. [Reproduced from George M, Ayuso E, Casellas A, Costa C, Devedjian JC, and Bosch F (2002) β Cell expression of IGF-I leads to recovery from type 1 diabetes. J Clin Invest 109:1153–1163. Copyright © 2002 American Society for Clinical Investigation. Used with permission.]
Fig. 11.
Fig. 11.
Evidence of increased abundance of IGF-IR+ cells in Crohn's disease: a, inflammatory cells; b, fibroblastoid cell; c, adipocytes; d, hypertrophied nerve plexus. Note the relative frequencies of IGF-IR+ cells in the lamina propria in uninvolved (e) and disease-involved (f) areas. [Reproduced from El Yafi F, Winkler R, Delvenne P, Boussif N, Belaiche J, and Louis E (2005) Altered expression of type I insulin-like growth factor receptor in Crohn's disease. Clin Exp Immunol 139:526–533. Copyright © 2005 British Society for Immunology. Used with permission.]
Fig. 12.
Fig. 12.
Immunohistochemical analysis of human bowel. a, increased number of IGF-IR positive inflammatory cells (in brown) in the mucosa and the submucosal in an involved area of Crohn's disease. b, increased number of IGF-IR positive inflammatory cells limited to the mucosa in an involved area of ulcerative colitis. c, no overexpression of IGF-IR in diverticulitis. d, immunohistochemistry with an anti-active caspase 3 antibody: positive inflammatory cells (in red) undergoing apoptosis in an uninvolved area of Crohn's disease. [Reproduced from El Yafi F, Winkler R, Delvenne P, Boussif N, Belaiche J, and Louis E (2005) Altered expression of type I insulin-like growth factor receptor in Crohn's disease. Clin Exp Immunol 139:526–533. Copyright © 2005 British Society for Immunology. Used with permission.].
Fig. 13.
Fig. 13.
IL-16-dependent chemoattraction and cytokine expression in GD orbital fibroblasts and RA synovial fibroblasts are induced by both GD-IgG and RA-IgG. Cultures were treated with nothing (control), IGF-I (10 nM), GD-IgG (100 ng/ml), or RA-IgG (100 ng/ml) overnight, and the medium was collected and subjected to T-cell migration assay (top) or enzyme-linked immunosorbent assay (bottom). Data are expressed as the mean ± S.D. of three determinations. *, statistically different migration in the presence of neutralizing Abs (top) or protein production (bottom) at the 5% confidence level. [Reprinted from Pritchard J, Tsui S, Horst N, Cruikshank WW, and Smith TJ (2004) Synovial fibroblasts from patients with rheumatoid arthritis, like fibroblasts from Graves' disease, express high levels of IL-16 when treated with Igs against insulin-like growth factor-1 receptor. J Immunol 173:3564–3569. Copyright © 2004 The American Association of Immunologists, Inc. Used with permission.]
Fig. 14.
Fig. 14.
Thin sections of spinal cord from control rats contain larger demyelinated areas, greater inflammation (A), and a greater abundance of demyelinated axons (arrows in C) than found in IGF-I-treated animals (B and D). Thin, short myelin segments (arrows) surround axons in D. Magnification, 600×. [Reproduced from Yao DL, Liu X, Hudson LD, and Webster HD (1995) Insulin-like growth factor I treatment reduces demyelination and up-regulates gene expression of myelin-related proteins in experimental autoimmune encephalomyelitis. Proc Natl Acad Sci USA 92:6190–6194. Copyright © 1995 United States National Academy of Sciences. Used with permission.]
Fig. 15.
Fig. 15.
Results from epitope map analysis of BIIB4 and BIIB5 on the surface of the X-ray crystal structure of the extracellular domains of IR based on homologous positions determined using a sequence alignment of IR and IGF-IR. [Reproduced from Doern A, Cao X, Sereno A, Reyes CL, Altshuler A, Huang F, Hession C, Flavier A, Favis M, Tran H, et al. (2009) Characterization of inhibitory anti-insulin-like growth factor receptor antibodies with different epitope specificity and ligand-blocking properties: implications for mechanism of action in vivo. J Biol Chem 284:10254–10267. Copyright © 2009 The American Society for Biochemistry and Molecular Biology. Used with permission.]
Fig. 16.
Fig. 16.
Strategies for drug discovery with a dimeric or dimerizing receptor tyrosine kinase. a, schematic illustration of the mechanism of receptor tyrosine kinase activation by ligand-induced dimerization. b, schematic illustration of the various possible strategies for the search/design of ligand mimetics and antagonists. PTP, protein tyrosine phosphatase; TK, tyrosine-kinase domain. [Reproduced from De Meyts P and Whittaker J (2002) Structural biology of insulin and IGF1 receptors: implications for drug design. Nat Rev Drug Discov 1:769–783. Copyright © 2002 Nature Publishing Group. Used with permission.]

References

    1. Abroun S, Ishikawa H, Tsuyama N, Liu S, Li FJ, Otsuyama K, Zheng X, Obata M, Kawano MM. (2004) Receptor synergy of interleukin-6 (IL-6) and insulin-like growth factor-I in myeloma cells that highly express IL-6 receptor α [published erratum appears in Blood 103:2891, 2004]. Blood 103:2291–2298 - PubMed
    1. Adams TE, Epa VC, Garrett TP, Ward CW. (2000) Structure and function of the type 1 insulin-like growth factor receptor. Cell Mol Life Sci 57:1050–1093 - PMC - PubMed
    1. Ahuja A, Shupe J, Dunn R, Kashgarian M, Kehry MR, Shlomchik MJ. (2007) Depletion of B cells in murine lupus: efficacy and resistance. J Immunol 179:3351–3361 - PubMed
    1. Alpdogan O, Muriglan SJ, Kappel BJ, Doubrovina E, Schmaltz C, Schiro R, Eng JM, Greenberg AS, Willis LM, Rotolo JA, et al. (2003) Insulin-like growth factor-I enhances lymphoid and myeloid reconstitution after allogeneic bone marrow transplantation. Transplantation 75:1977–1983 - PubMed
    1. Ambrosini G, Adida C, Altieri DC. (1997) A novel anti-apoptosis gene, survivin, expressed in cancer and lymphoma. Nat Med 3:917–921 - PubMed

Publication types

MeSH terms

Substances