

Repression of cardiac phospholamban gene expression is mediated by thyroid hormone receptor-{alpha}1 and involves targeted covalent histone modifications
- PMID: 20392835
- PMCID: PMC2875831
- DOI: 10.1210/en.2009-1241
Repression of cardiac phospholamban gene expression is mediated by thyroid hormone receptor-{alpha}1 and involves targeted covalent histone modifications
Abstract
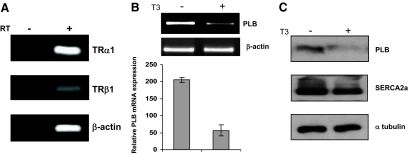
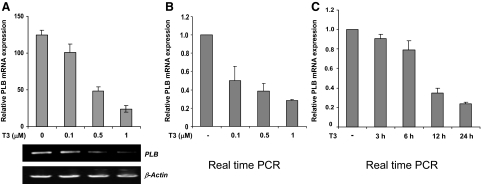
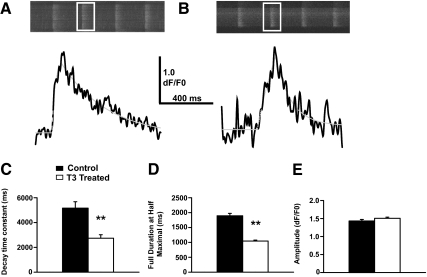
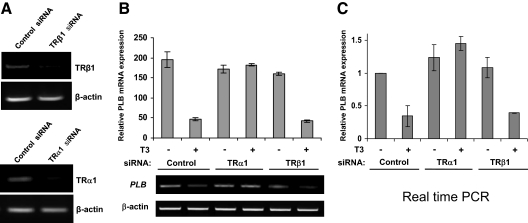
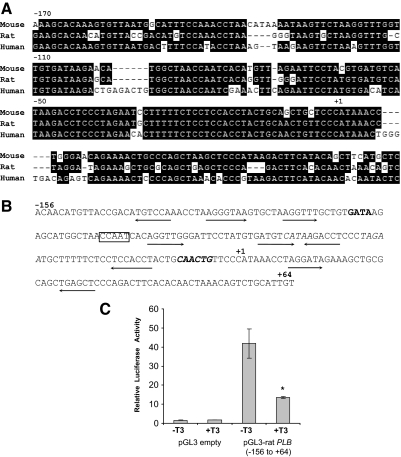
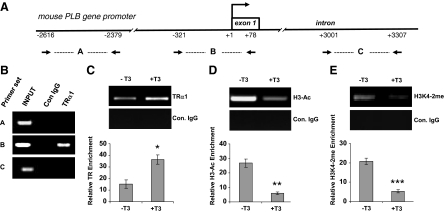
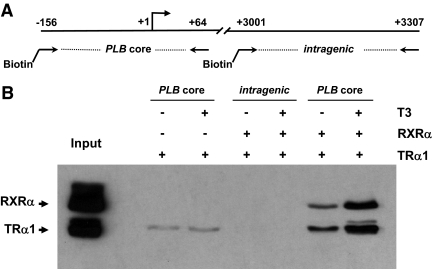
Phospholamban (PLB) is a critical regulator of Ca(2+) cycling in heart muscle cells, and its gene expression is markedly down-regulated by T(3). Nonetheless, little is known about the molecular mechanisms of T(3)-dependent gene silencing in cardiac muscle, and it remains unclear whether thyroid hormone receptors (TRs) directly bind at the PLB gene in vivo and facilitate transcriptional repression. To investigate the regulatory role of TRs in PLB transcription, we used a physiological murine heart muscle cell line (HL-1) that retains cardiac electrophysiological properties, expresses both TRalpha1 and TRbeta1 subtypes, and exhibits T(3)-dependent silencing of PLB expression. By performing RNA interference assays with HL-1 cells, we found that TRalpha1, but not TRbeta1, is essential for T(3)-dependent PLB gene repression. Interestingly, a PLB reporter gene containing only the core promoter sequences -156 to +64 displayed robust T(3)-dependent silencing in HL-1 cells, thus suggesting that transcriptional repression is facilitated by TRalpha1 via the PLB core promoter, a regulatory region highly conserved in mammals. Consistent with this notion, chromatin immunoprecipitation and in vitro binding assays show that TRalpha1 directly binds at the PLB core promoter region. Furthermore, addition of T(3) triggered alterations in covalent histone modifications at the PLB promoter that are associated with gene silencing, namely a pronounced decrease in both histone H3 acetylation and histone H3 lysine 4 methylation. Taken together, our data reveal that T(3)-dependent repression of PLB in cardiac myocytes is directly facilitated by TRalpha1 and involves the hormone-dependent recruitment of histone-modifying enzymes associated with transcriptional silencing.
Figures
Similar articles
-
Divergent regulation of cardiac KCND3 potassium channel expression by the thyroid hormone receptors alpha1 and beta1.J Physiol. 2009 Mar 15;587(Pt 6):1319-29. doi: 10.1113/jphysiol.2008.168385. Epub 2009 Jan 26. J Physiol. 2009. PMID: 19171649 Free PMC article.
-
Feedback on hypothalamic TRH transcription is dependent on thyroid hormone receptor N terminus.Mol Endocrinol. 2002 Jul;16(7):1652-66. doi: 10.1210/mend.16.7.0868. Mol Endocrinol. 2002. PMID: 12089358
-
Inhibition of thyroid hormone receptor α1 impairs post-ischemic cardiac performance after myocardial infarction in mice.Mol Cell Biochem. 2013 Jul;379(1-2):97-105. doi: 10.1007/s11010-013-1631-9. Epub 2013 Mar 27. Mol Cell Biochem. 2013. PMID: 23532677
-
Phospholamban and sarcolipin: Are they functionally redundant or distinct regulators of the Sarco(Endo)Plasmic Reticulum Calcium ATPase?J Mol Cell Cardiol. 2016 Feb;91:81-91. doi: 10.1016/j.yjmcc.2015.12.030. Epub 2015 Dec 29. J Mol Cell Cardiol. 2016. PMID: 26743715 Free PMC article. Review.
-
Bile salt excretory pump: biology and pathobiology.J Pediatr Gastroenterol Nutr. 2006 Jul;43 Suppl 1:S10-6. doi: 10.1097/01.mpg.0000226385.71859.5f. J Pediatr Gastroenterol Nutr. 2006. PMID: 16819395 Review.
Cited by
-
Triiodothyronine supplementation and cytokines during cardiopulmonary bypass in infants and children.J Thorac Cardiovasc Surg. 2012 Oct;144(4):938-943.e2. doi: 10.1016/j.jtcvs.2012.05.063. Epub 2012 Jun 27. J Thorac Cardiovasc Surg. 2012. PMID: 22743177 Free PMC article. Clinical Trial.
-
New insights into the role of thyroid hormone in cardiac remodeling: time to reconsider?Heart Fail Rev. 2011 Jan;16(1):79-96. doi: 10.1007/s10741-010-9185-3. Heart Fail Rev. 2011. PMID: 20668933 Review.
-
Maternal and fetal thyroid dysfunction following porcine reproductive and respiratory syndrome virus2 infection.Vet Res. 2020 Mar 30;51(1):47. doi: 10.1186/s13567-020-00772-2. Vet Res. 2020. PMID: 32228691 Free PMC article.
-
Physiologic Significance of Epigenetic Regulation of Thyroid Hormone Target Gene Expression.Eur Thyroid J. 2020 May;9(3):114-123. doi: 10.1159/000506423. Epub 2020 Mar 24. Eur Thyroid J. 2020. PMID: 32523888 Free PMC article. Review.
-
Synergistic effects of hormones on structural and functional maturation of cardiomyocytes and implications for heart regeneration.Cell Mol Life Sci. 2023 Aug 5;80(8):240. doi: 10.1007/s00018-023-04894-6. Cell Mol Life Sci. 2023. PMID: 37541969 Free PMC article. Review.
References
-
- Kahaly GJ, Dillmann WH 2005 Thyroid hormone action in the heart. Endocr Rev 26:704–728 - PubMed
-
- Klein I, Ojamaa K 2001 Thyroid hormone and the cardiovascular system. N Engl J Med 344:501–509 - PubMed
-
- Carr AN, Kranias EG 2002 Thyroid hormone regulation of calcium cycling proteins. Thyroid 12:453–457 - PubMed
-
- Fazio S, Palmieri EA, Lombardi G, Biondi B 2004 Effects of thyroid hormone on the cardiovascular system. Recent Prog Horm Res 59:31–50 - PubMed
-
- Yen PM 2001 Physiological and molecular basis of thyroid hormone action. Physiol Rev 81:1097–1142 - PubMed
Publication types
MeSH terms
Substances
Grants and funding
LinkOut - more resources
Full Text Sources
Miscellaneous
