. 2010 Jul;84(13):6410-24.
doi: 10.1128/JVI.02273-09. Epub 2010 Apr 14.

Protein kinase A phosphorylation activates Vpr-induced cell cycle arrest during human immunodeficiency virus type 1 infection

Affiliations

Protein kinase A phosphorylation activates Vpr-induced cell cycle arrest during human immunodeficiency virus type 1 infection

R Anthony Barnitz et al. J Virol. 2010 Jul.

Abstract

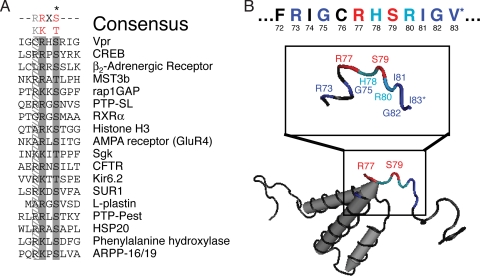
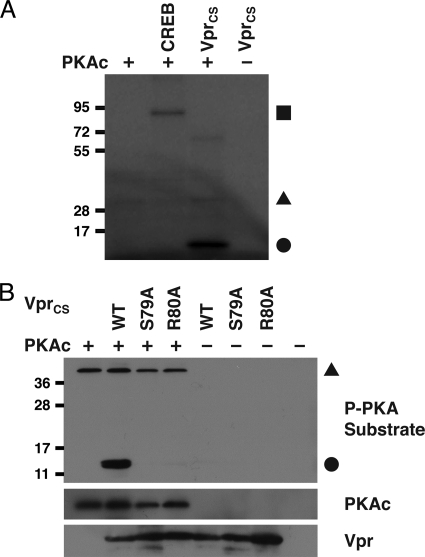
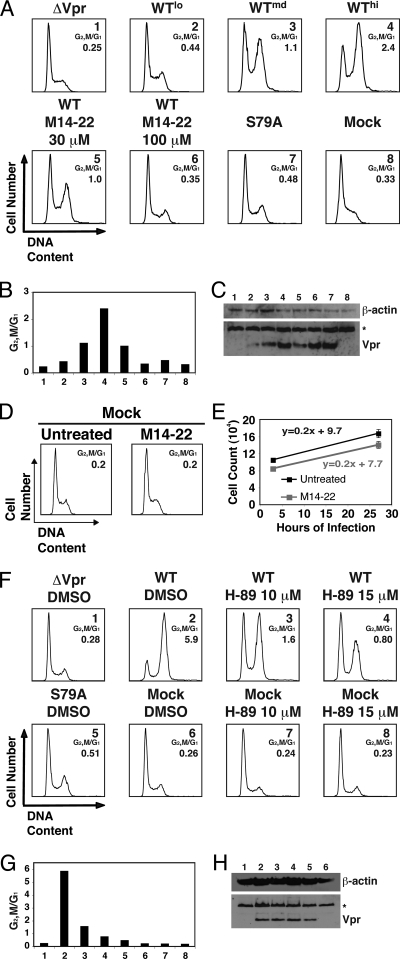
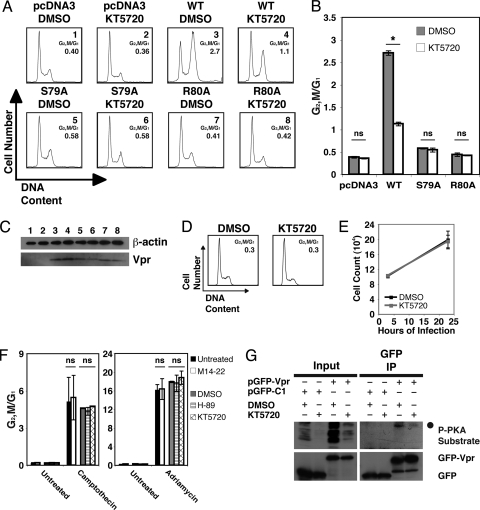
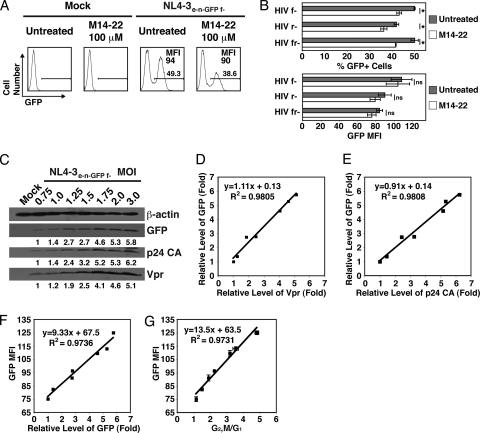
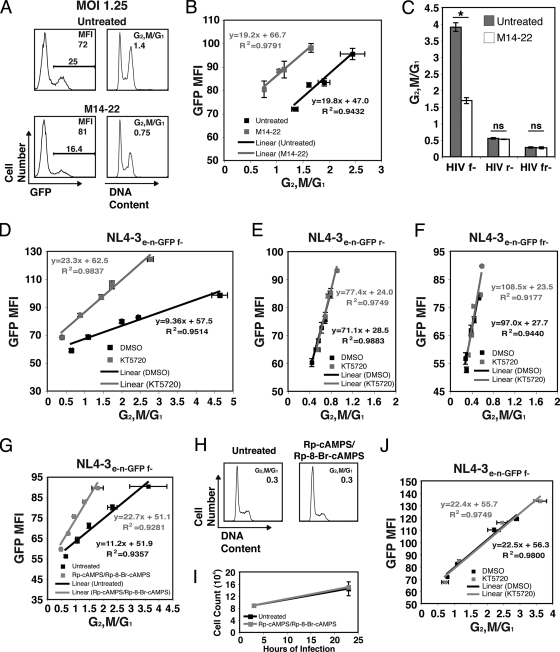
Infection with human immunodeficiency virus type 1 (HIV-1) causes an inexorable depletion of CD4(+) T cells. The loss of these cells is particularly pronounced in the mucosal immune system during acute infection, and the data suggest that direct viral cytopathicity is a major factor. Cell cycle arrest caused by the HIV-1 accessory protein Vpr is strongly correlated with virus-induced cell death, and phosphorylation of Vpr serine 79 (S79) is required to activate G(2)/M cell cycle blockade. However, the kinase responsible for phosphorylating Vpr remains unknown. Our bioinformatic analyses revealed that S79 is part of a putative phosphorylation site recognized by protein kinase A (PKA). We show here that PKA interacts with Vpr and directly phosphorylates S79. Inhibition of PKA activity during HIV-1 infection abrogates Vpr cell cycle arrest. These findings provide new insight into the signaling event that activates Vpr cell cycle arrest, ultimately leading to the death of infected T cells.


Figures

FIG. 1.
FIG. 1.
Serine 79 and arginine 80 are critical residues for Vpr cell cycle arrest in T cells. (A) Schematic of the NL4-3 HIV-1 molecular clones used. The clone NL4-3e-n-GFP lacks a functional env gene, due to a frameshift mutation, and the nef gene was replaced with EGFP. The D186N reverse transcriptase, Vpr Δ22-88 mutant (RTm, Vpr Δ22-88), is a nonreplicative clone that lacks endogenous Vpr and is used to deliver transcomplemented functional Vpr via virions into target cells without viral integration or replication. (B) WT or mutant Vpr proteins (denoted by the single-letter amino acid changes) were delivered (Vprv) into Jurkat cells. Virions containing WT Vpr were titrated (lo, low; md, medium; hi, high) so that a matched Vpr protein control could be compared to the mutants. Histograms of cell cycle analysis at 42 h postinfection show DNA content of DRAQ5-stained cells by flow cytometry. The ratio of G2/M to G1 (as in panel C) in each infection is shown. (C) G1 and G2/M populations were modeled by using the Watson Pragmatic cell cycle model, and the ratio was plotted for the cells corresponding to the same numbered samples in panel B. (D) Western blot of the Jurkat cells in panel B for WT and mutant virion-delivered Vpr (bottom). β-Actin is shown as a protein loading control (top). (E) Jurkat cells were cotransfected with pcDNA3-hVpr plasmids expressing WT or mutant Vpr (or the empty vector control) and pEGFP-N1 as a transfection marker at a ratio of 5:1. Histograms of cell cycle analysis at 61 h posttransfection show DNA content of GFP+, DRAQ5-stained cells by flow cytometry. (F) G1 and G2/M populations were modeled and plotted as in panel C for the cells corresponding to the same numbered samples in panel E. (G) Western blot of the Jurkat cells in panel E for WT or mutant Vpr (bottom) with β-actin shown as a protein loading control (top).
FIG. 2.
FIG. 2.
Serine 79 of Vpr is within a putative PKA phosphorylation motif. (A) Alignment of PKA target sites in human physiological substrates of PKA (adapted from Shabb [72]). The asterisk (*) indicates the phosphorylated serine or threonine. Gray shading indicates conserved residues defining the simple consensus PKA recognition motif (top). (B) Diagram of the nuclear magnetic resonance structure of HIV-1 Vpr (PDB 1M8L), indicating the location of serine 79 (bottom). Serine 79 and the surrounding residues of the extended PKA phosphorylation preferred motif are shown in the inset with the primary sequence of amino acids in Vpr from HIV-1 NL4-3 (top). The two residues forming the putative simple phosphorylation site are indicated in red. Other important residues are colored light and dark blue for minor and major contributing amino acids, respectively. *I83 (middle) in the structure is a valine (top) in the NL4-3 Vpr protein sequence used in the present study (GenBank accession no. AAK08485.1).
FIG. 3.
FIG. 3.
Vpr interacts with PKA. (A) Western blots of 293T cells transfected with plasmids encoding GFP alone or GFP-Vpr and DsRed-PKA, immunoprecipitated (IP) with antibodies against GFP or an isotype control (IgG) and then immunoblotted for DsRed (top) and GFP (middle). A blot of the immunoprecipitation antibody light chain is shown to control for equivalent amounts of immunoprecipitated antibodies (bottom). (B) (Top panels) Western blots of Jurkat cells infected with NL4-3e-n-GFP encoding either WT or R80A mutant Vpr, immunoprecipitated with antibodies against PKAc and then immunoblotted for PKAc (top) and Vpr (bottom). The virus encoding WT Vpr was titrated (lo, MOI = 1; hi, MOI = 1.5) to match the Vpr protein control to that of the R80A Vpr virus (MOI = 1.5). Uninfected, mock-treated cells were used as a negative control. (Bottom panels) Western blots of Jurkat cells infected with NL4-3e-n-GFP encoding WT Vpr, immunoprecipitated with either antibodies against PKAc or no antibody, and then immunoblotted for PKAc (top), protein G (middle), and Vpr (bottom). Uninfected, mock-treated cells were used as a negative control. The asterisk denotes the heavy chain of the antibodies used to immunoprecipitate PKAc. (C) 293T cells were transfected with pECFP-N1 and pEYFP-N1-derived constructs, expressing enhanced CFP and enhanced YFP, respectively. FC-FRET analysis was performed 24 h posttransfection on live unfixed CFP/YFP double-positive cells (or CFP-positive cells in the CFP-only controls) as indicated by the gate in the density plots on the left. The control YFP Vpr and CFP cotransfected cells serve as the baseline (shaded) for the FRET signal of the other transfections (bold line) in each histogram. The MFI of the FRET signal is indicated for each sample. (D) 293T cells were transfected with pECFP-N1- and pEYFP-C1-derived constructs. FRET analysis by flow cytometry was performed 24 h posttransfection on CFP/YFP double-positive cells, as indicated by the gate in the density plots on the left. The CFP-Vpr and YFP cotransfected cells serve as the baseline (shaded) for the FRET signal of the other transfections (bold line) in each histogram. The MFI of the FRET signal is indicated for each sample.
FIG. 4.
FIG. 4.
PKA phosphorylates serine 79 of Vpr. (A) An in vitro kinase assay was performed by incubating 50 ng of recombinant PKA catalytic subunit (PKAc) with 1 μg of either recombinant CREB or chemically synthesized full-length WT Vpr (Vprcs) and 0.5 μCi of [γ-32P]ATP. Autoradiography detected phosphorylated CREB (▪), phosphorylated Vpr (•), and autophosphorylated PKA (▴). (B) Western blots of a nonradioactive in vitro kinase assay performed by incubating 100 ng of recombinant PKAc with 1 μg of WT and mutant (S79A and R80A) Vprcs. Phosphorylated Vpr (•) and autophosphorylated PKA (▴) was detected by using an anti-phospho (P) PKA substrate antibody (top). Total protein levels of PKAc (middle) and Vpr (bottom) are shown, and the positions of size markers (relative migration in kilodaltons) are indicated at the left of each blot.
FIG. 5.
FIG. 5.
Inhibition of PKA kinase activity abrogates virion-delivered Vpr cell cycle arrest. (A) Vpr was delivered by nonreplicative virions (Vprv) into Jurkat cells and the samples were treated with M14-22 (30 or 100 μM) at the time of infection. Untreated WT Vprv was titrated (lo, low; md, medium; hi, high) to provide a matched Vpr protein control for the M14-22-treated samples. Cells were also infected with virions containing no Vpr (ΔVpr), virions containing mutant Vpr (S79A), or uninfected (Mock). Histograms of cell cycle analysis at 24 h postinfection show DNA content of propidium iodide-stained cells by flow cytometry. (B) G2/M and G1 populations were modeled by using the Dean-Jett-Fox cell cycle model, and the ratio was plotted for the cells corresponding to the numbered samples in panel A. (C) Western blot of the correspondingly numbered samples in panel A displays Vpr (bottom) or β-actin (top). The asterisk denotes a cellular protein cross-reactive with the Vpr antibody that serves as a secondary loading control. (D) Jurkat cells were mock infected and either left untreated or treated with M14-22 (100 μM). Histograms of cell cycle analysis at 26 h postinfection show DNA content of DRAQ5-stained cells by flow cytometry. G1 and G2/M populations were modeled by using the Watson Pragmatic cell cycle model, and the ratio was determined. (E) Total viable cell counts at 2 and 26 h postinfection for the mock-infected samples in panel C measured by constant time flow cytometry (data are represented as mean ± the standard deviation [SD] of duplicates and are representative of more than five experiments). Linear regression analysis of the data was performed and plotted as a line with the equation. (F) WT Vpr was delivered (Vprv) into Jurkat cells and treated with either the DMSO vehicle or H-89 (10 or 15 μM) at the time of infection. Virions devoid of Vpr (ΔVpr), mutant Vprv (S79A) delivery, and mock infection were included as controls. Histograms of cell cycle analysis at 22 h postinfection show DNA content of propidium iodide-stained cells by flow cytometry. (G) G2/M and G1 populations were modeled by using the Watson Pragmatic cell cycle model, and the ratio was plotted for the cells corresponding to the numbered samples in panel F. (H) Western blot indicates Vpr protein delivery for DMSO- or H-89-treated Jurkat cells in panel F (bottom). β-Actin is shown as a protein loading control (top). The asterisk in the bottom blot denotes a cross-reactive cellular protein that is used as a secondary loading control.
FIG. 6.
FIG. 6.
Cell cycle arrest induced by transfected Vpr is reduced by inhibition of PKA activity. (A) Jurkat cells were cotransfected with pcDNA3-hVpr plasmids expressing WT or mutant Vpr (or the empty vector control) and pEGFP-N1 as a transfection marker at a ratio of 5:1. At 24 h posttransfection, the cells were replated and treated with either DMSO or KT5720 (1 μM). Histograms of cell cycle analysis at 36 h posttreatment show DNA content of GFP+, DRAQ5-stained cells by flow cytometry. (B) G2/M and G1 populations were modeled by using the Watson Pragmatic cell cycle model, and the ratio was plotted for the cells corresponding to the samples in panel A (data are represented as mean ± the SD of duplicates). The asterisk denotes P < 0.001 as analyzed by one-way analysis of variance (ANOVA) with multiple-comparison tests. ns, Not significant. (C) Western blot of the Jurkat cells in panel A indicates protein levels for WT or mutant Vpr (bottom). β-Actin is shown as a protein loading control (top). (D) Jurkat cells were treated with either DMSO or KT-5720 (1 μM). Histograms of cell cycle analysis at 23 h posttreatment show DNA content of DRAQ5-stained cells by flow cytometry. G1 and G2/M populations were modeled by using the Watson Pragmatic cell cycle model, and the ratio was determined. (E) Total viable cell counts at 3 and 23 h posttreatment for the samples in panel F measured by constant time flow cytometry (data are represented as mean ± the SD of duplicates and are representative of more than five experiments). (F) Jurkat cells were either untreated or treated with camptothecin (left) or adriamycin (right) and then either left untreated or secondarily treated with M14-22 (100 μM), DMSO, H-89 (15 μM), or KT-5720 (1 μM). Histograms of cell cycle analysis at 48 h (camptothecin) or 24 h (adriamycin) posttreatment show DNA content of DRAQ5-stained cells by flow cytometry. G1 and G2/M populations were modeled by using the Watson Pragmatic cell cycle model, and the ratio was determined and plotted (data are represented as mean ± the SD of duplicates and are representative of three experiments). Statistical analysis showed no significant difference (ns) between PKA inhibitors versus the vehicle treated controls by two-way ANOVA. (G) Western blots of 293T cells transfected with plasmids encoding either GFP or GFP-Vpr and treated with either DMSO or KT5720 (10 μM), immunoprecipitated with antibodies against GFP, and then immunoblotted for phosphorylated PKA substrates (top) and GFP (bottom). The P-PKA substrate antibody reveals phosphorylated Vpr (•) in the GFP immunoprecipitation (IP).
FIG. 7.
FIG. 7.
M14-22 treatment reduces HIV-1 infection, and GFP expression from the virus correlates with overall viral expression. (A) Jurkat cells were either mock infected or infected with NL4-3e-n-GFP f- encoding WT Vpr at an MOI of 2 and either not treated or treated with M14-22 (100 μM). Histograms of GFP expression at 26 h postinfection show the percentage of infected cells (GFP+ gate) and the GFP MFI of infected cells. (B) Jurkat cells were infected with NL4-3e-n-GFP f- (HIV f-) encoding WT Vpr and null for Vif, infected with NL4-3e-n-GFP r- (HIV r-) encoding WT Vif and null for Vpr, or infected with NL4-3e-n-GFP fr- (HIV fr-) that is null for both Vif and Vpr at an MOI of 2 and either not treated or treated with M14-22 (100 μM). The percentage of infected GFP+ cells (top) and the GFP MFI in the infected cells (bottom) were plotted for the infected samples (data are represented as mean ± the SD of triplicates from three separate experiments). The asterisk denotes P < 0.01 as analyzed by one-way ANOVA with multiple comparison tests. ns, Not significant. (C) Jurkat cells were infected with NL4-3e-n-GFP f- encoding WT Vpr at the indicated MOIs. Western blot of Jurkat cells indicates expression levels for Vpr, HIV-1 p24 capsid (CA), and GFP at 27 h postinfection. β-Actin is shown as a protein loading control (top). Densitometry of all bands was performed, and the intensity of each viral protein band was normalized to β-actin. The fold change in viral protein expression is shown under the Western blot for each. (D) The fold change of Vpr based on Western blot analysis in panel C was plotted against that of GFP based on the Western blot analysis in panel C. Linear regression analysis of the data was performed and plotted as a line with the equation and R2 value. (E) HIV-1 p24 CA was plotted against GFP and analyzed as in panel D. (F) Flow cytometry to assess GFP expression was performed at 26 h postinfection. The fold change of GFP was plotted against the GFP MFI for each MOI in panel C. Linear regression analysis of the data was performed as in panel D. (G) Flow cytometry to assess GFP MFI and DNA content using DRAQ5 was performed at 26 h postinfection. G1 and G2/M populations were modeled by using the Watson Pragmatic cell cycle model, and the ratio was plotted against the GFP MFI for each MOI (data are represented as mean ± the SD of duplicates and are representative of more than five experiments). Linear regression analysis of the data was performed as in panel D.
FIG. 8.
FIG. 8.
Inhibiting PKA activity reduces Vpr cell cycle arrest during HIV-1 infection. (A) Jurkat cells were infected with NL4-3e-n-GFP f- encoding WT Vpr at MOIs of 1.25, 1.5, 1.75, and 2 and either left untreated or treated with 100 μM M14-22. Histograms of GFP expression at 23 h postinfection with an MOI of 1.25 show the percentage of infected cells (GFP+ gate) and the GFP MFI in infected cells (left) by flow cytometry. Histograms of cell cycle analysis at 23 h postinfection show the DNA content of infected (GFP+), DRAQ5-stained cells by flow cytometry (right). (B) The ratios of G2/M to G1 populations were modeled from the infection in panel A by using the Watson Pragmatic cell cycle model, and the ratio was plotted against the GFP MFI for each MOI (right) (data are represented as mean ± the SD of duplicates and are representative of more than five experiments). Linear regression analysis of the data was performed and plotted as a line with the equation and R2 value listed. Statistical analysis showed that the slopes were not statistically different (P = 0.892), but the x axis intercepts differed significantly (P < 0.00017), reflecting the competitive inhibitory effect of M14-22 on G2/M cell cycle arrest. (C) Jurkat cells were infected with NL4-3e-n-GFP f- (HIV f-) encoding WT Vpr and null for Vif, infected with NL4-3e-n-GFP r- (HIV r-) encoding WT Vif and null for Vpr, or infected with NL4-3e-n-GFP fr- (HIV fr-) that is null for both Vif and Vpr at an MOI of 2 and either untreated or treated with M14-22 (100 μM). Flow cytometry to assess GFP MFI and DNA content using DRAQ5 was performed at 26 h postinfection. G1 and G2/M populations were modeled by using the Watson Pragmatic cell cycle model, and the ratio was plotted (data are represented as mean ± the SD of triplicates and are representative of three experiments). The asterisk denotes P < 0.001 as analyzed by one-way ANOVA with multiple comparison tests. ns, Not significant. (D) Jurkat cells were infected with NL4-3e-n-GFP f- encoding WT Vpr at MOIs of 0.75, 1.25, 1.75, 2, and 3 and treated with either DMSO (vehicle control) or KT5720 (1 μM). Flow cytometric assessment of GFP and DNA was performed as in panels A and B, and the G2/M and G1 ratios were analyzed and plotted as in panel B (data are represented as mean ± the SD of duplicates and are representative of more than five experiments). Statistical analysis showed that the slopes were statistically different (P < 0.0001), reflecting the noncompetitive inhibitory effect of KT5720 on G2/M cell cycle arrest. (E) Jurkat cells were infected with NL4-3e-n-GFP r- encoding WT Vif and null for Vpr as in panel D. Flow cytometric analysis was performed, and the data were plotted as in panel D (data are represented as mean ± the SD of duplicates and are representative of three experiments). Statistical analysis showed no significant differences between the slopes (P = 0.457) or the x-axis intercepts (P = 0.951). (F) Jurkat cells were infected with NL4-3e-n-GFP fr- that is null for both Vif and Vpr as in panel D. Flow cytometric analysis was performed, and the data were plotted as in panel D (data are represented as mean ± the SD of duplicates and are representative of three experiments). Statistical analysis showed no significant differences between the slopes (P = 0.617) or the x-axis intercepts (P = 0.605). (G) Jurkat cells were infected with NL4-3e-n-GFP f- encoding WT Vpr at MOIs of 0.75, 1.25, 1.75, 2, and 3 and either left untreated or treated with the combination of Rp-cAMPS (500 μM) and Rp-8-Br-cAMPS (500 μM). Flow cytometric assessment of GFP and DNA performed as in panel D, and G2/M and G1 ratios were analyzed and plotted as in panel D (data are represented as mean ± the SD of duplicates and are representative of three experiments). Statistical analysis showed that the slopes were statistically different (P < 0.0003), reflecting the noncompetitive inhibitory effect of cAMP analogs on G2/M cell cycle arrest. (H) Jurkat cells were either left untreated or treated with the combination of Rp-cAMPS (500 μM) and Rp-8-Br-cAMPS (500 μM). Histograms of cell cycle analysis at 23 h posttreatment show DNA content of DRAQ5-stained cells by flow cytometry. G1 and G2/M populations were modeled by using the Watson Pragmatic cell cycle model, and the ratio was determined. (I) Total viable cell counts at 3 and 23 h posttreatment for the samples in panel H measured by constant time flow cytometry (data are represented as mean ± the SD of duplicates and are representative of three experiments). (J) Jurkat cells were infected with NL4-3e-n-GFP f- encoding WT Vpr produced from 293T cells treated with either DMSO or KT5720 (1 μM) at MOIs of 0.75, 1.25, 2.5, and 3. Flow cytometric assessment of GFP and DNA was performed as in panel D, and the G2/M and G1 ratios were determined and plotted as in panel D (data are represented as mean ± the SD of duplicates and are representative of three experiments). Statistical analysis showed no significant differences between the slopes (P = 0.982) or the x-axis intercepts (P = 0.748).
FIG. 9.
FIG. 9.
Endogenous expression of protein kinase inhibitor (PKI) reduces Vpr cell cycle arrest during HIV-1 infection. (A) Jurkat cells were cotransfected with a p3xFLAG-PKI expression plasmid (or the empty vector control) and pDsRed-N1as a transfection marker at a ratio of 3:1. The transfected cells were infected with NL4-3e-n-GFP f- encoding WT Vpr at MOIs of 1.25, 1.75, 2, and 2.5 at 38 h posttransfection. Flow cytometry to assess GFP MFI and DNA content using DRAQ5 was performed at 23 h postinfection. The ratios of G2/M and G1 populations were modeled by using the Watson Pragmatic cell cycle model, and the ratio was plotted against the GFP MFI for each MOI (data are represented as mean ± the SD of duplicates and are representative of three experiments). Linear regression analysis of the data was performed and plotted as a line with the equation and R2 value listed. Statistical analysis showed that the slopes were not statistically different (P = 0.149), but the x axis intercepts differed significantly (P < 0.0001) reflecting the competitive inhibitory effect of PKI on G2/M cell cycle arrest. (B) Western blot of the Jurkat cells in panel A indicates expression of PKI by an immunoblot for FLAG (bottom). β-Actin is shown as a protein loading control (top). (C) Jurkat cells transfected as in panel A and left untreated. Histograms of cell cycle analysis at 23 h posttreatment show DNA content of DRAQ5-stained cells by flow cytometry. G1 and G2/M populations were modeled by using the Watson Pragmatic cell cycle model, and the ratio was determined. (D) Total viable cell counts at 3 and 23 h posttreatment for the samples in panel C measured by constant time flow cytometry (data are represented as mean ± the SD of duplicates and are representative of three experiments).

Similar articles

Cited by

References

    1. Adams, S. R., A. T. Harootunian, Y. J. Buechler, S. S. Taylor, and R. Y. Tsien. 1991. Fluorescence ratio imaging of cyclic AMP in single cells. Nature 349:694-697. - PubMed
    1. Agostini, I., S. Popov, T. Hao, J. H. Li, L. Dubrovsky, O. Chaika, N. Chaika, R. Lewis, and M. Bukrinsky. 2002. Phosphorylation of Vpr regulates HIV type 1 nuclear import and macrophage infection. AIDS Res. Hum. Retrovir. 18:283-288. - PubMed
    1. Altfeld, M., M. M. Addo, R. L. Eldridge, X. G. Yu, S. Thomas, A. Khatri, D. Strick, M. N. Phillips, G. B. Cohen, S. A. Islam, S. A. Kalams, C. Brander, P. J. Goulder, E. S. Rosenberg, and B. D. Walker. 2001. Vpr is preferentially targeted by CTL during HIV-1 infection. J. Immunol. 167:2743-2752. - PubMed
    1. Bachand, F., X. J. Yao, M. Hrimech, N. Rougeau, and E. A. Cohen. 1999. Incorporation of Vpr into human immunodeficiency virus type 1 requires a direct interaction with the p6 domain of the p55 gag precursor. J. Biol. Chem. 274:9083-9091. - PubMed
    1. Belzile, J. P., G. Duisit, N. Rougeau, J. Mercier, A. Finzi, and E. A. Cohen. 2007. HIV-1 Vpr-mediated G2 arrest involves the DDB1-CUL4AVPRBP E3 ubiquitin ligase. PLoS Pathog. 3:e85. - PMC - PubMed

Publication types

MeSH terms

Substances