. 2010 Apr 14;30(15):5404-14.
doi: 10.1523/JNEUROSCI.4893-09.2010.

Neuronal pentraxins mediate silent synapse conversion in the developing visual system

Affiliations

Neuronal pentraxins mediate silent synapse conversion in the developing visual system

Selina M Koch et al. J Neurosci. .

Abstract

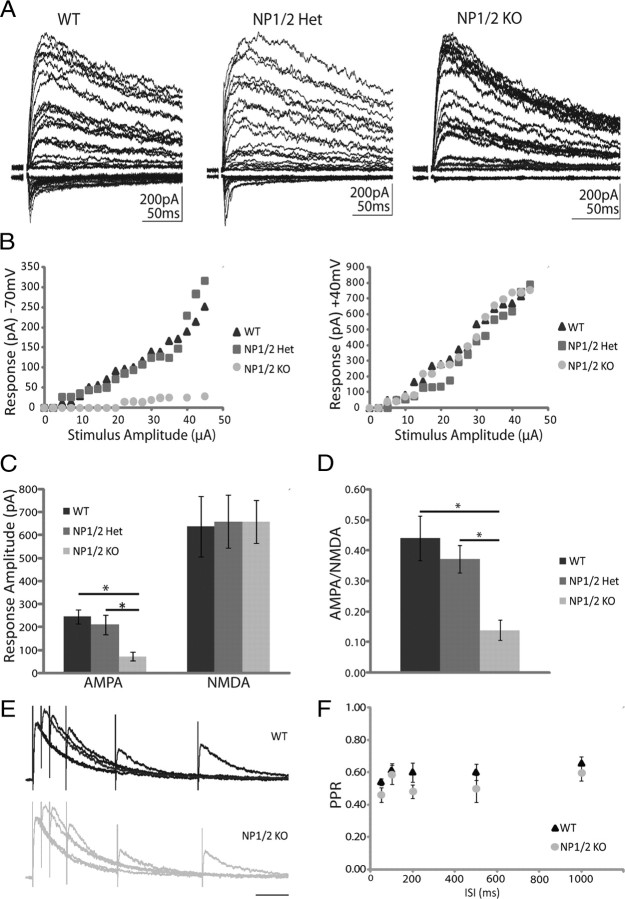
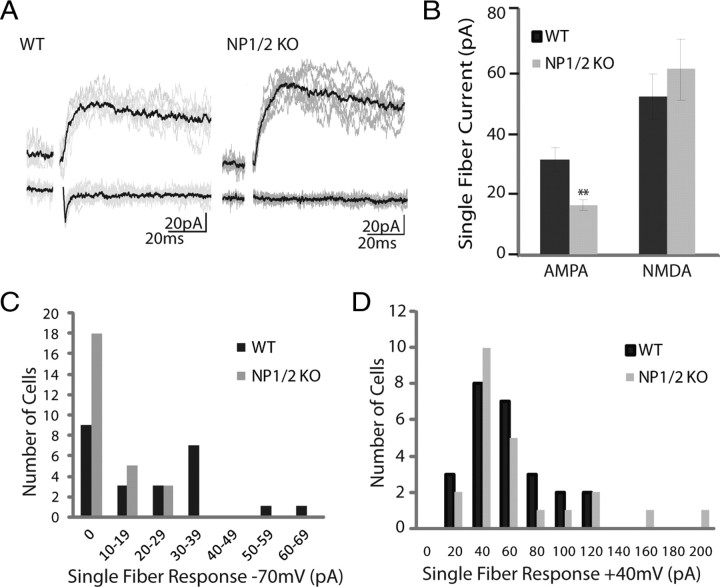
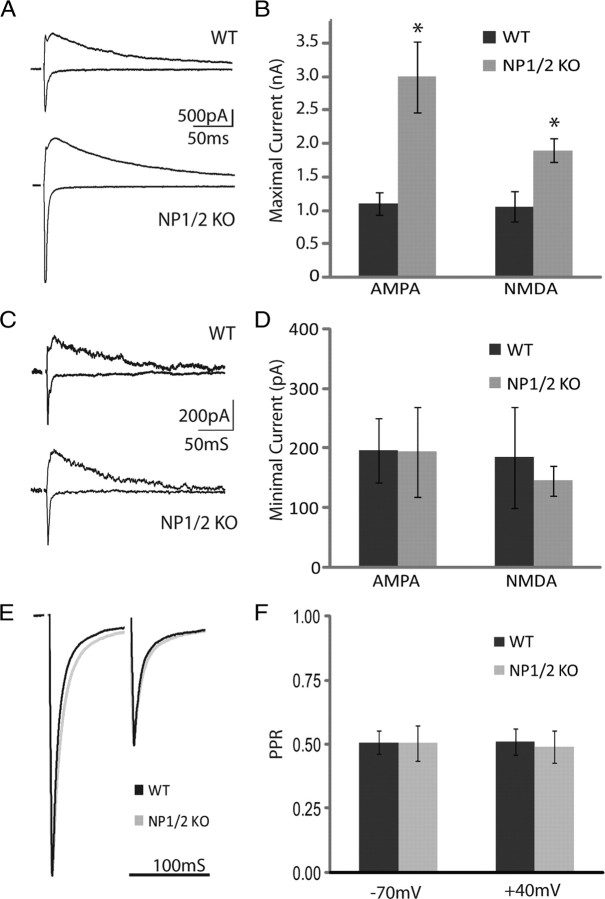
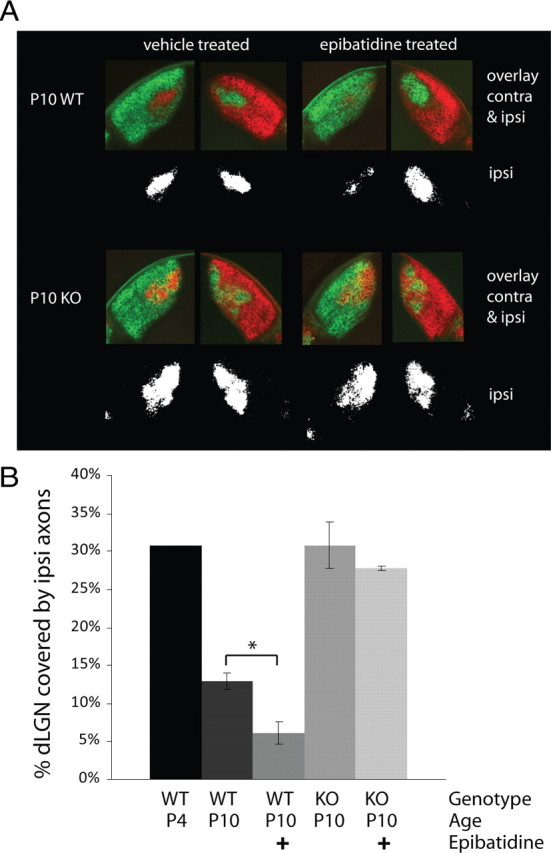
Neuronal pentraxins (NPs) are hypothesized to play important roles in the recruitment of AMPA receptors (AMPARs) to immature synapses, yet a physiological role for NPs at nascent synapses in vivo has remained elusive. Here we report that the loss of NP1 and NP2 (NP1/2) leads to a dramatic and specific reduction in AMPAR-mediated transmission at developing visual system synapses. In thalamic slices taken from early postnatal mice (<P10) NP1/2 knock-out (KO) neurons displayed severely reduced AMPAR-mediated retinogeniculate transmission. The reduced currents reflected an increased number of silent synapses with no change in quantal amplitude or presynaptic release. These are the first data to demonstrate that NP1/2 are required in vivo for the normal development of AMPAR-mediated transmission. In addition, they suggest a novel role for NP1/2 in silent synapse conversion during a discrete developmental period when visual circuit connections are undergoing eye-specific refinement. After this period, retinogeniculate transmission not only recovered in the knock-outs but became excessive. The enhanced currents were attributable, at least in part, to a deficit in the characteristic elimination of functional inputs that occurs in the developing dLGN. These data indicate that the loss of NP1/2 disrupts several aspects of retinogeniculate development including the initial establishment of AMPAR transmission and the subsequent elimination of inappropriate circuit connections.


Figures

Figure 1.
Figure 1.
NP1/2 knock-out neurons have a specific deficit in AMPAR-mediated synaptic transmission during early postnatal development (P6–P9). A, Example traces of postsynaptic responses from WT, NP1/2 Het, and NP1/2 KO dLGN neurons voltage clamped at −70 mV (downward currents) and +40 mV (upward currents) where the optic tract was stimulated over a range of stimulus intensities. B, Example input–output curves showing EPSC amplitude as a function of stimulus intensity at −70 mV and +40 mV. C, Average amplitudes of maximal AMPAR and NMDAR-mediated currents. D, Average AMPA/NMDA ratios of maximal currents. C, D, n = 9 WT animals (26 cells), 6 NP1/2 Het animals (15 cells), and 6 NP1/2 KO animals (26 cells). Data displayed as mean ± SEM and compared by one-way ANOVA followed by Bonferroni post-tests. *p < 0.05. E, Example traces from a WT neuron (upper) and a NP1/2 KO neuron (lower) voltage clamped at +40 mV and stimulated with pairs of pulses at 5 different interstimulus intervals (50, 100, 200, 500, and 1000 ms). F, The average PPRs for WTs (3 animals, 8 cells) and NP1/2 KO neurons (2 animals, 4 cells) over the 5 ISIs tested. No differences were found by two-way ANOVA followed by Bonferroni post-tests.
Figure 2.
Figure 2.
Quantal size is not reduced in early postnatal NP1/2 KO dLGN neurons (P6–P9). A, Examples of evoked responses in the absence and presence of Sr+2. Top left traces shows a WT recording in our regular Ca2+-containing external. The middle trace shows the WT response to the Sr2+ external. The bottom right trace is an example from an NP1/2 KO recording in Sr2+. Traces display an initial fast response (arrows) followed by delayed release of quantal events (asterisks). B, Overlay of the average miniature even from a WT neuron (black) and an NP1/2 KO neuron (gray). C, Cumulative probability histogram shows the average of the individual cumulative probability histograms. Distributions were not different by a Kolmogorov–Smirnov test. Data displayed as mean ± SEM. For WTs n = 4 animals (13 cells), and for KOs n = 3 animals (10 cells).
Figure 3.
Figure 3.
Young NP1/2 KO dLGN neurons (P6 through P9) have an increased number of silent synapses. A, Example traces from WT (left) and NP1/2 KO (right) neurons at +40 and −70 mV showing responses to minimal stimulation (7.5 μA for both cells). WT neuron shows responses at both +40 and −70 mV, whereas NP1/2 KO neuron shows a response only at +40 mV. B, Average amplitudes of presumed single fiber responses at −70 mV and +40 mV. C, Histogram of single fiber responses of WT and NP1/2 KO neurons held at −70 mV. Note the increase in the number of NP1/2 KO neurons that showed no response. D, Histogram of single fiber responses of WT and NP1/2 KO neurons held at +40 mV. B–D, Data displayed as mean ± SEM. **p < 0.01. Dataset included 24 cells from 8 WT animals and 26 cells from 6 KO animals.
Figure 4.
Figure 4.
P17 to P20 NP1/2 KO animals strengthen AMPAR-mediated currents by an NP1/2-independent mechanism and develop aberrantly large current amplitudes. A, Example traces at +40 mV and −70 mV from WT and NP1/2 KO neurons at age P19 showing maximal evoked responses (50 μA stimulus). B, Average saturating AMPAR and NMDAR-mediated responses. C, Example traces of presumed single fiber responses from a WT neuron (10 μA stimulus) and a KO neuron (7.5 μA stimulus) recorded at +40 mV and −70 mV. D, Average minimal AMPAR and NMDAR-mediated responses. B, D, Data displayed as mean ± SEM. For WTs n = 8 animals and 17 cells. For KOs n = 9 animals and 17 cells. *p < 0.05. E, Examples of PPRs at −70 mV in cyclothiazide. F, Quantification of PPRs recorded at −70 mV and +40 mV. For −70 mV recordings n = 3 WT animals (8 cells) and n = 2 KO animals and 6 cells. For +40 mV recordings n = 2 animals and 4 cells for both genotypes. Data displayed as mean ± SEM.
Figure 5.
Figure 5.
NP1/2 KOs display abnormal input elimination during development. A, Example traces showing a “refined” P18 WT neuron (top) and an “unrefined” P18 NP1/2 KO neuron (bottom). B, The total current divided by the presumably single fiber current for WT and NP1/2 KO neurons held at −70 mV and +40 mV. Dataset includes 17 WT cells from 6 animals and 17 KO cells from 7 animals. *p < 0.05. C, WT and KO neurons were classified into unrefined, resolving, and refined categories based on the number of stepwise increases in synaptic current amplitudes observed in response in increasing stimulus intensity. WT dataset includes 16 cells from 6 animals and KO dataset includes 14 cells from 6 animals.
Figure 6.
Figure 6.
Monocular retinal activity blockade with epibatidine between the ages of P4 and P10 does not drive axon remodeling in the NP1/2 KO dLGN. A, Examples of RGC axon labeling in the dLGN of P10 vehicle-treated (left column) and epibatidine-treated (right column) WT (top row) and NP1/2 KO (bottom row) animals. Fluorescent images show the arborization patterns of both the contralateral and ipsilateral afferents, whereas the black-and-white images below display the thresholded ipsilateral projections. For the epibatidine-treated animals, the drug-treated eye received red label. Note the diminished ipsilateral projection from the epibatidine-treated eye in the WT example, whereas epibatidine failed to diminish the ipsilateral projection in the KO example. B, Bar graph quantifying the percentage of dLGN area over which the ipsilateral axons extend. In WT animals epibatidine treatment reduced the area covered by the ipsilateral axons (n = 3 WT vehicle-treated animals and n = 4 WT drug-treated animals), whereas epibatidine had no effect on the ipsilateral axons in the NP1/2 KO animals (n = 4 KO animals in each group). Note that the ipsilateral projection is larger in the P10 KOs than in the WTs and is similar in size to the ipsi projection of an unrefined P4 WT mouse. B, Data displayed as mean ± SEM. Data analyzed by one-way ANOVA followed by Bonferroni multiple-comparisons test. *p < 0.05.

References

    1. Barria A, Malinow R. Subunit-specific NMDA receptor trafficking to synapses. Neuron. 2002;35:345–353. - PubMed
    1. Bjartmar L, Huberman AD, Ullian EM, Rentería RC, Liu X, Xu W, Prezioso J, Susman MW, Stellwagen D, Stokes CC, Cho R, Worley P, Malenka RC, Ball S, Peachey NS, Copenhagen D, Chapman B, Nakamoto M, Barres BA, Perin MS. Neuronal pentraxins mediate synaptic refinement in the developing visual system. J Neurosci. 2006;26:6269–6281. - PMC - PubMed
    1. Chen C, Regehr WG. Developmental remodeling of the retinogeniculate synapse. Neuron. 2000;28:955–966. - PubMed
    1. Chen C, Regehr WG. Presynaptic modulation of the retinogeniculate synapse. J Neurosci. 2003;23:3130–3135. - PMC - PubMed
    1. Cho RW, Park JM, Wolff SB, Xu D, Hopf C, Kim JA, Reddy RC, Petralia RS, Perin MS, Linden DJ, Worley PF. mGluR1/5-dependent long-term depression requires the regulated ectodomain cleavage of neuronal pentraxin NPR by TACE. Neuron. 2008;57:858–871. - PMC - PubMed

Publication types

MeSH terms