. 2010 Apr 14;30(15):5415-25.
doi: 10.1523/JNEUROSCI.0076-10.2010.

Combined adaptiveness of specific motor cortical ensembles underlies learning

Affiliations

Combined adaptiveness of specific motor cortical ensembles underlies learning

Fritzie Arce et al. J Neurosci. .

Abstract

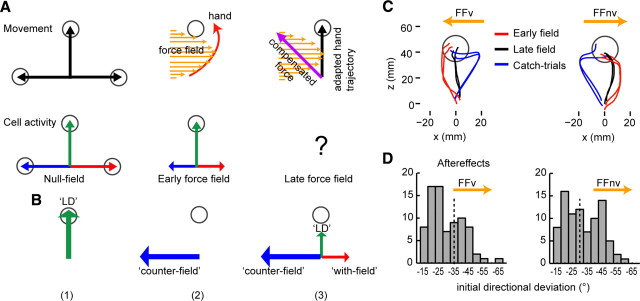
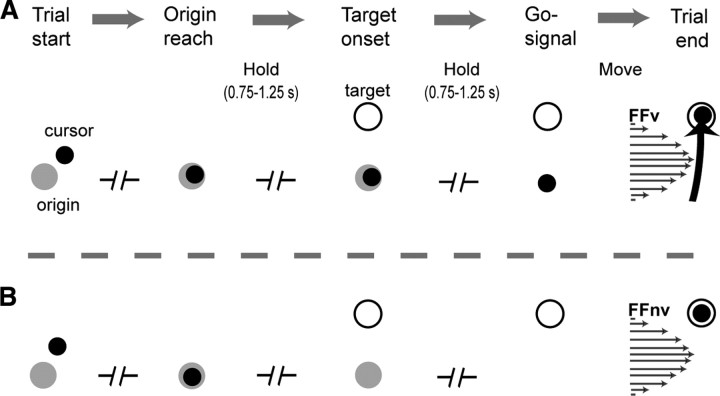
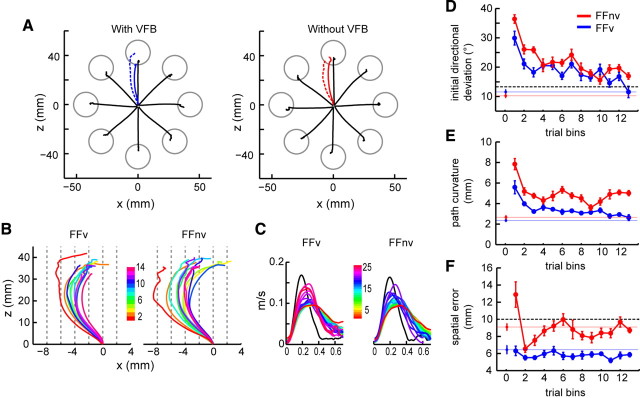
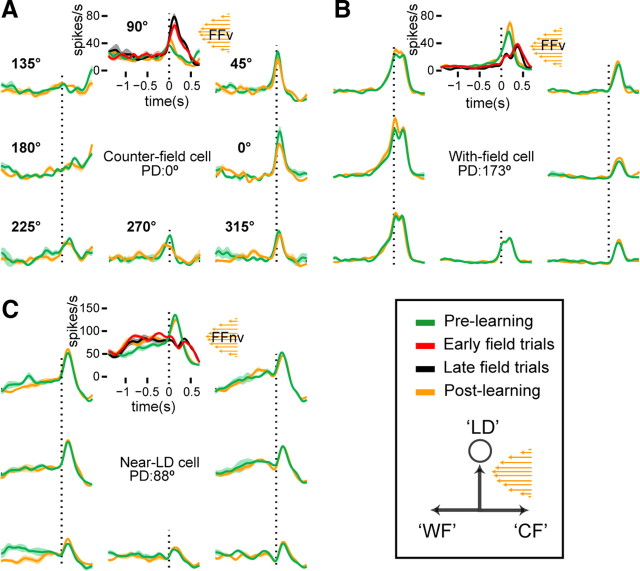
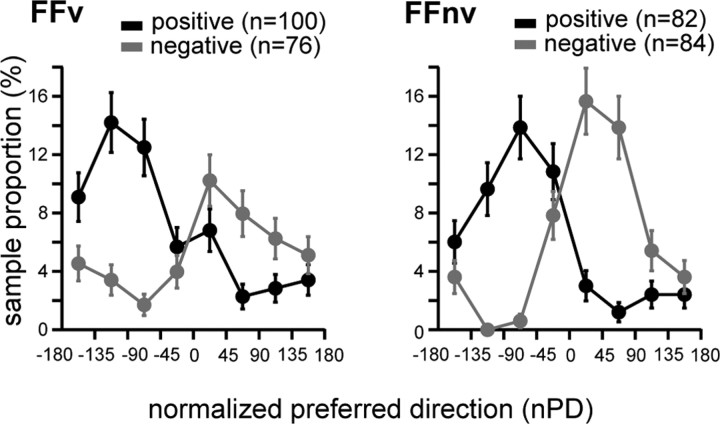
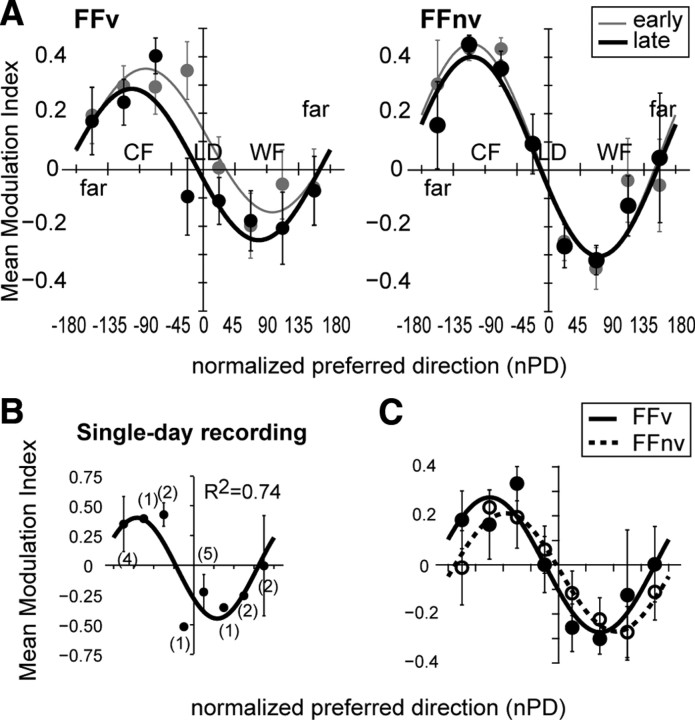
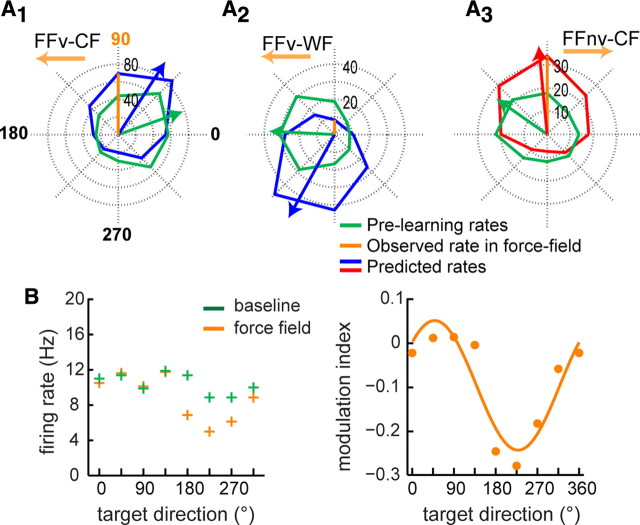
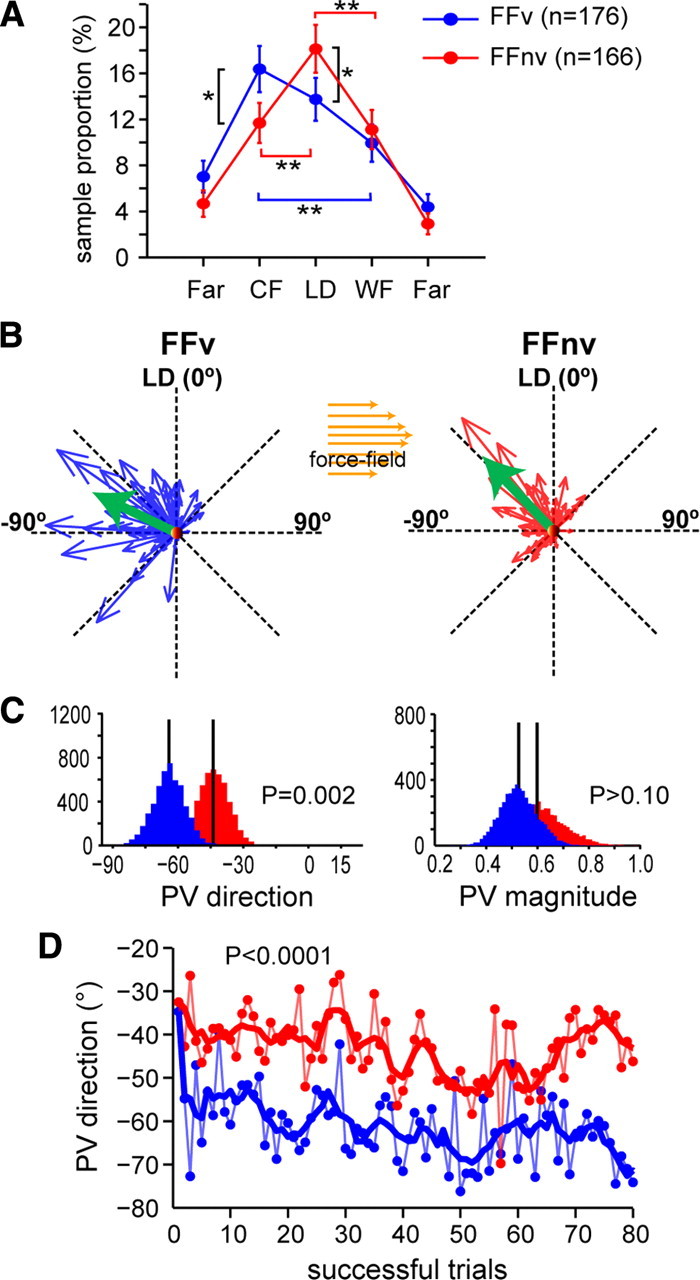
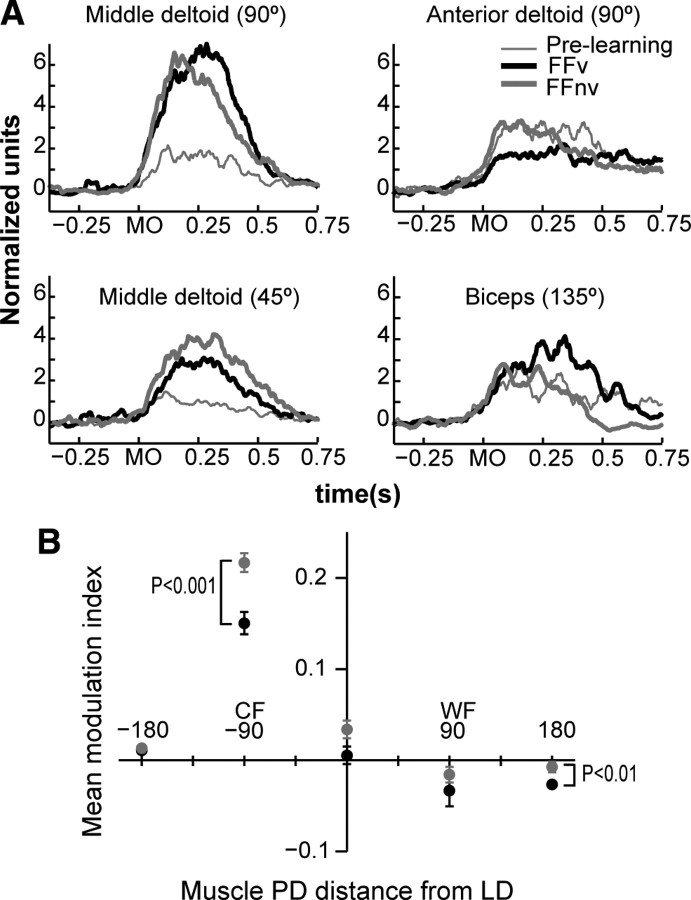
Learning motor skills entails adaptation of neural computations that can generate or modify associations between sensations and actions. Indeed, humans can use different strategies when adapting to dynamic loads depending on available sensory feedback. Here, we examined how neural activity in motor cortex was modified when monkeys made arm reaches to a visual target and locally adapted to curl force field with or without visual trajectory feedback. We found that firing rates of a large subpopulation of cells were consistently modulated depending on the distance of their preferred direction from the learned movement direction. The newly acquired activity followed a cosine-like function, with maximal increase in directions that opposed the perturbing force and decrease in opposite directions. As a result, the combined neuronal activity generated an adapted population vector. The results suggest that this could be achieved without changing the tuning properties of the cells. This population directional signal was however altered in the absence of visual feedback; while the cosine pattern of modulation was maintained, the population distributions of modulated cells differed across feedback consistent with the different trajectory shapes. Finally, we predicted generalization patterns of force-field learning based on the cosine-like modulation. These conformed to reported features of generalization in humans, suggesting that the generalization function was related to the observed rate modulations in the motor cortex. Overall, the findings suggest that the new combined activation of neuronal ensembles could underlie the change in the internal model of movement dynamics in a way that depends on available sensory feedback and chosen strategy.


Figures

Figure 1.
Figure 1.
Schema of hypothetical activity of different cells to generate adapted movements under force field. A, Left, Trajectories in the absence of force field are straight (upper row, black arrows). Firing rate of cells whose PD corresponds to these directions are marked by the length of the colored arrows (lower row). Center, Trajectory (red, upper row) deviates in the direction of the force field (orange arrows) as nonadapted cells fire as in the null-field (lower row). For simplicity, the viscous curl force field was represented as straight lines whose length varied to reflect the bell-shaped velocity profile. Note that the direction of the force field was always orthogonal to the direction of movement. Right, When monkeys effectively anticipate the force properties (orange) and generate a compensatory direction (purple), the hand takes an approximately straight path (black) when reaching to the target. B, Two possibilities: (1) adaptive changes in one subpopulation of cells in which activity increases for cells with PD near the LD (B1) or those with PD orthogonal to the LD (B2); and (2) adaptive changes in different subpopulations of cells (B3) in which activity increases for cells with PD that counters the force field and decreases with PD along the direction where force field assists movement. C, Behavioral after-effects. Hand paths corresponding to single trials (early and late force field trials and catch trials) from the same recording day for each feedback condition (counterclockwise, FFv; clockwise, FFnv). Deviations of hand paths in catch trials (blue) were mirror images of the deviations early in adaptation (red). D, Histograms of the initial directional deviations of all catch trials. The directional deviations are expressed in angles. Negative values denote directional deviations opposite to the force field direction. Initial directional deviations did not differ with and without VFB (t test, p > 0.10). The mean directional deviations of significant after-effects [i.e., those above 2 SD from the mean directional deviation (dashed vertical lines) of control trials] reflect the compensatory direction (FFv = −45 ± 2° and FFnv = −41 ± 2° for LD at 0° convention).
Figure 2.
Figure 2.
Behavioral task. A, B, Trial flow in force field with visual feedback (FFv) (A) and without (FFnv) (B). A, With VFB, the cursor is seen throughout the movement. B, Without VFB, cursor disappears at target onset and appears only at trial end.
Figure 3.
Figure 3.
Behavioral performance during adaptations to force field. A, Average hand paths during prelearning null (black) and field reaches with and without VFB [averaged trajectories of the first (dashed line) and last 10 (solid line) field trials]. Data from all recording days. B, Average hand paths across field trials (10 trials/bin). The x-axis is enlarged to show lateral path deviations. C, Velocity profiles of null (black) and field (colored) reaches averaged across trials (five successful trials/bin). D–F, Means and ±1 SE of initial directional deviation (D), path curvature (E), and spatial errors (F) during adaptation (10 trials/bin). Isolated points and colored lines denote baseline values of the same directions used in the learning blocks. Dashed black lines in D and F denote error level that achieves reward. While spatial error was sufficiently reduced to achieve success, trajectory errors were not fully compensated without VFB.
Figure 4.
Figure 4.
Changes of single unit's activity during adaptations to force field. Perievent time histograms (PETH and ±1 SE), smoothed by a 50 ms-Gaussian kernel, show mean discharge of M1 neurons during prelearning (green) and postlearning (orange) reaches to eight directions and during early (red) and late (black) field reaches to 90°. PETHs are aligned at movement onset (dashed vertical line) for counter field (A), with-field (B), and near-LD (C) cells. During adaptation, activity around movement onset increased in the cell shown in A but decreased in the cells shown in B and C. See supplemental Figure 2 (available at www.jneurosci.org as supplemental material) for the raster plots.
Figure 5.
Figure 5.
Modulation of neuronal activity depends on the cells' PD distance from the learned direction. Sample proportion of cells (y-axis) according to the cells' normalized PD (x-axis) is shown for each feedback condition. The population was divided into positively (black) and negatively (gray) modulated cells. The nPDs, which indicate the distance of the cells' PD from the LD, were binned into eight ranges. Negative nPDs denote nPDs opposite to the force-field direction. With VFB, cells with positive modulation were more frequent than negative modulation (binomial test; p < 0.05), while without VFB, no such difference was found (p > 0.10).
Figure 6.
Figure 6.
Adaptive modulation follows a cosine. A, Population modulation index (y-axis) as a function of normalized PDs (x-axis) is shown separately for early and late phases of adaptation and for each feedback condition. Each point denotes the mean modulation index across cells within a range of nPDs: near-LD (±45°), counter-field (−46 to −135°), with-field (46 to 135°), and far-LD (136 to 180°, −136 to −180°). Positive values indicate increased firing rates in field reaches. Population modulation index showed a good fit to cosine (R2 for early and late phases were = 0.91 ± 0.06 and 0.88 ± 0.09 for FFv, respectively, and 0.93 ± 0.07 and 0.95 ± 0.04 for FFnv, reespectively). Modulation index did not differ between early and late phases (paired Wilcoxon test, p > 0.10) nor between feedback conditions (Mann–Whitney, p < 0.05). The PDs (late phase: FFv = −100°; FFnv = −109°) and the amplitudes (late phase, FFv = 0.28; FFnv = 0.36) of the cosine fit were not significantly different with and without VFB (bootstrap, p > 0.10). Error bars are ±1 SE. B, As in A, but for a single-day recording where 15–20 cells modulated by force field were simultaneously recorded. C, Population modulation indexes corresponding to neural activity from 300 ms before movement onset to 200 ms after. Shown for late force field trials of each feedback condition. The population modulation index fit the cosine model well (R2 for FFv = 0.97; R2 FFnv = 0.88).
Figure 7.
Figure 7.
Predicted firing rates in force field based upon the cosine model. A, Polar plots of single neurons' prelearning firing rates (green) and predicted force-field firing rates (red/blue) for FFv counter-field (A1), FFv with-field (A2), and FFnv counter-field (A3). Observed force-field firing rate at the LD (90° in all cases) is also shown (orange). Note that the PDs of the predicted rates (red/blue arrows) are significantly shifted from the PD in prelearning (green arrows) in the direction of the force field (orange arrow). That is, PD shifts clockwise for clockwise force field (A1 and A2) and counterclockwise for counterclockwise force field (A3). B, Left, A single cell's average firing rates in baseline (green) versus force field (orange) learned in all eight directions. Reproduced from Gandolfo et al. (2000), their Fig. 3b. (Copyright © 2000 National Academy of Sciences, U.S.A.). Right, Modulation index calculated for each direction show a good cosine fit (R2 = 0.85), consistent with our model predictions.
Figure 8.
Figure 8.
Population distributions of modulated cells differ between feedback contexts. A, Population distribution of cells (n = 342) according to their nPDs and feedback condition. The FFv distribution is negatively skewed relative to the LD (−0.07), while the FFnv distribution was positively skewed (0.07). Skewness was calculated as follows: S = E(x − μ)33 where μ is the mean of x, σ is the standard deviation of x, and E(t) is the expected value of t. Error bars are ±1 SE. Brackets correspond to significant comparisons between nPD ranges within (colored) and between feedback (black) conditions (*p = 0.01; **p < 0.001). B, Population vectors during force-field adaptations (green) did not point to the hand movement direction. In both feedback conditions, they pointed toward the compensatory direction [FFv = −64.2° (−65.3°, −63.2°); FFnv = −43.6° (−44.5°, −42.8°)]. Similar results were obtained when PVs were calculated separately for each monkey (a, FFv = −51.7°; FFnv = −33.3°; bootstrap, p = 0.03; B, FFv = −72.0°; FFnv = −46.0°; bootstrap, p = 0.003). PVs were calculated using mean firing rates of late force-field trials (41–80). C, Histograms of the direction and magnitude of PVs shown in B, obtained from resampling using the bootstrap technique, show significant differences in direction but not in magnitude. D, PV direction calculated trial-by-trial (dotted line, raw data; solid line, smoothed data) during adaptations to force fields with and without VFB.
Figure 9.
Figure 9.
Forelimb EMG responses to force field. A, Average normalized EMG activity of representative shoulder and elbow muscles that showed significant change of activity from prelearning to late field reaches to specified targets. Activity was aligned at movement onset (MO). These muscles also showed significantly different activities between feedback conditions. B, Mean modulation index of EMG activity as a function of the distance of muscle PD from LD and cosine fit for each feedback condition. Error bars: ±1 SE, p values are shown for significant comparisons between feedback conditions.

References

    1. Aflalo TN, Graziano MS. Partial tuning of motor cortex neurons to final posture in a free-moving paradigm. Proc Natl Acad Sci U S A. 2006;103:2909–2914. - PMC - PubMed
    1. Arce F, Novick I, Vaadia E. Washington, DC: Society for Neuroscience; 2008. Learning-induced modulation of motor cortical activity during adaptations to force fields with and without visual feedback. Program No. 277.13.
    1. Arce F, Novick I, Shahar M, Link Y, Ghez C, Vaadia E. Differences in context and feedback result in different trajectories and adaptation strategies in reaching. PLoS One. 2009;4:e4214. - PMC - PubMed
    1. Ashe J, Georgopoulos AP. Movement parameters and neural activity in motor cortex and area 5. Cereb Cortex. 1994;4:590–600. - PubMed
    1. Batschelet E. Circular statistics in biology. London: Academic; 1981.

Publication types