. 2010 Apr 14;30(15):5465-79.
doi: 10.1523/JNEUROSCI.5083-09.2010.

Focal cortical infarcts alter intrinsic excitability and synaptic excitation in the reticular thalamic nucleus

Affiliations

Focal cortical infarcts alter intrinsic excitability and synaptic excitation in the reticular thalamic nucleus

Jeanne T Paz et al. J Neurosci. .

Abstract

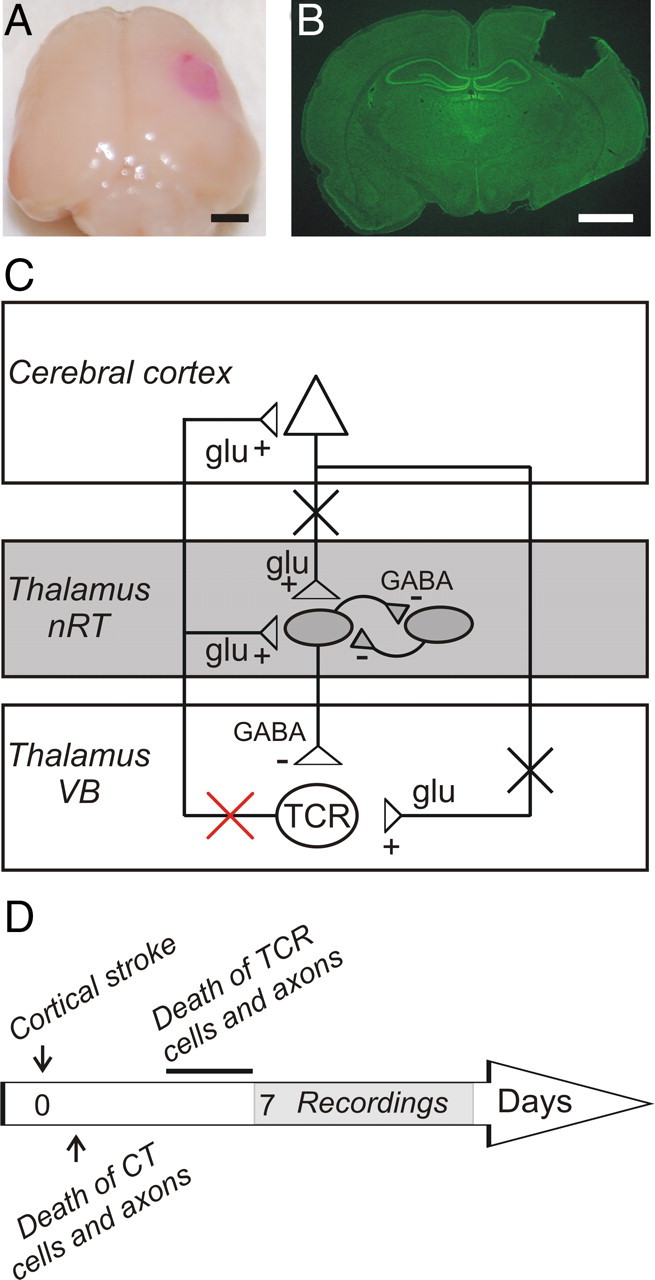
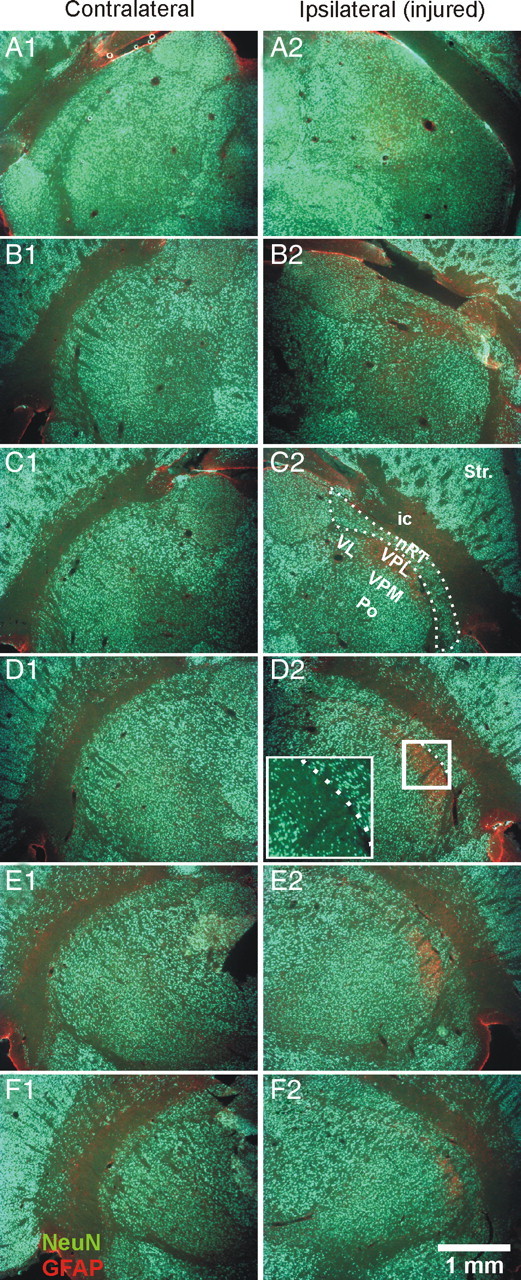
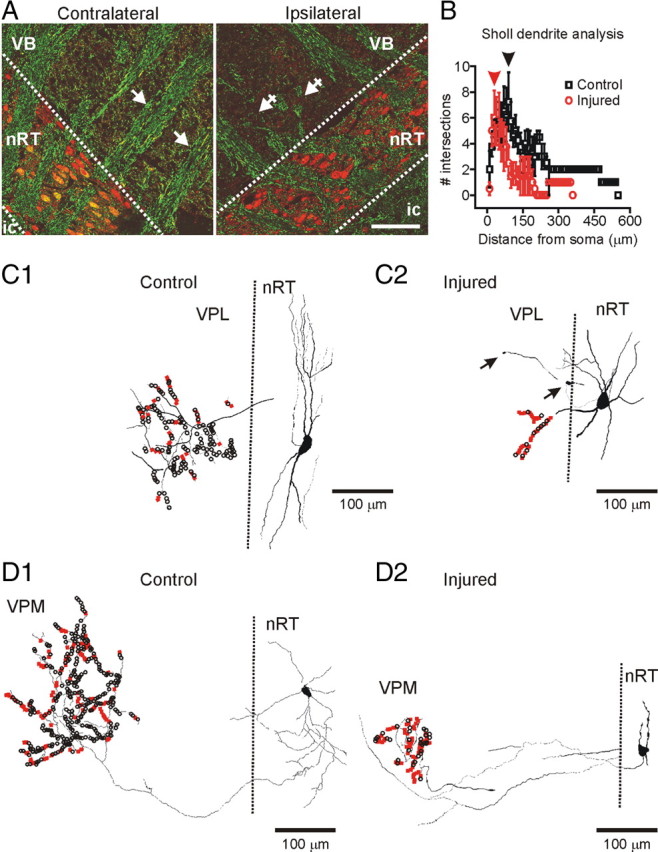
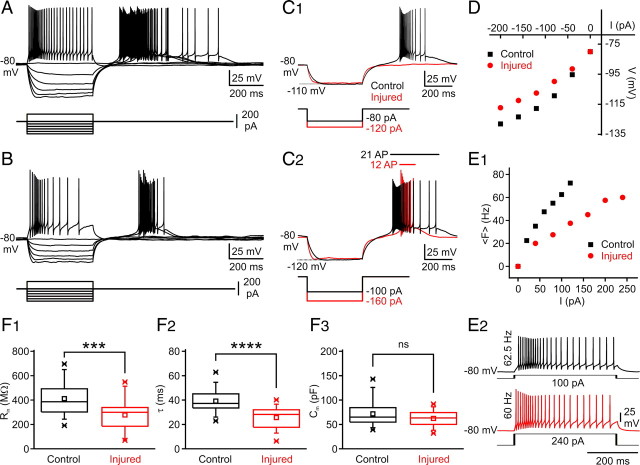
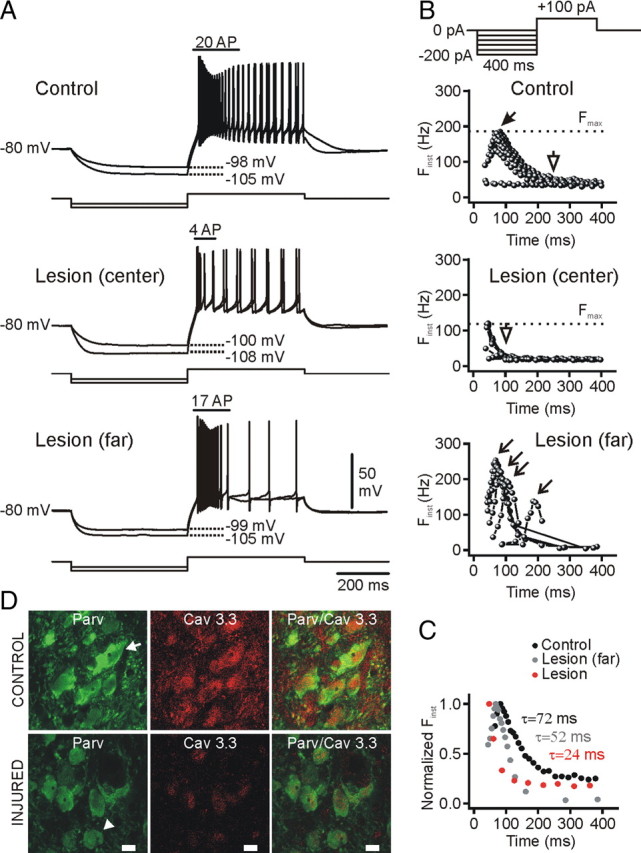
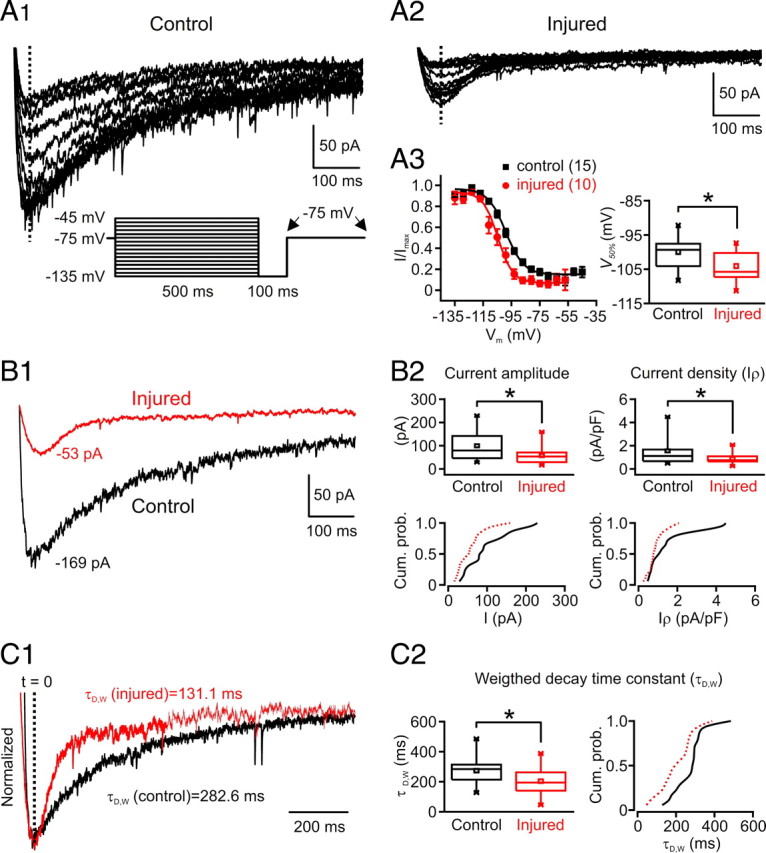
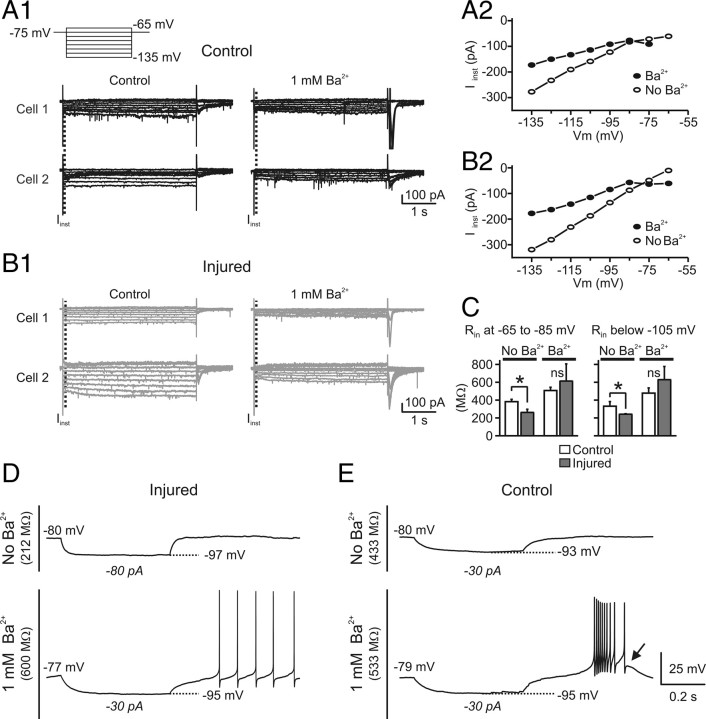
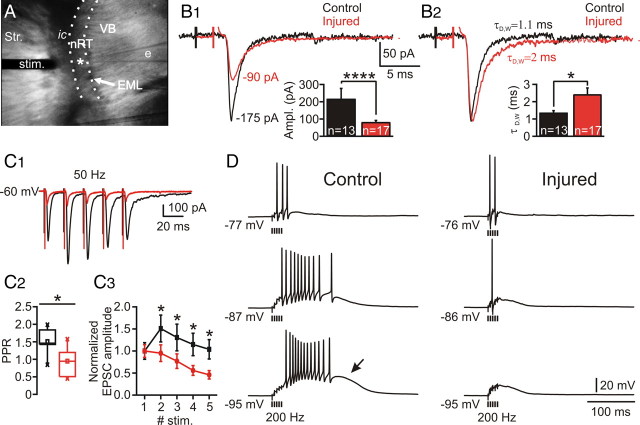
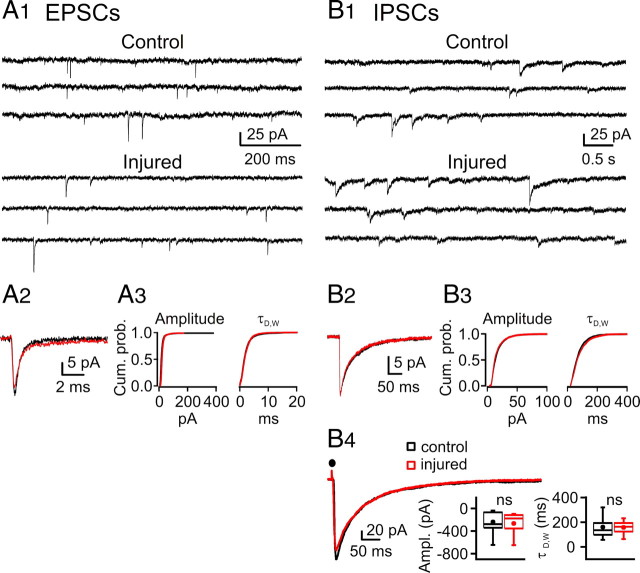
Focal cortical injuries result in death of cortical neurons and their efferents and ultimately in death or damage of thalamocortical relay (TCR) neurons that project to the affected cortical area. Neurons of the inhibitory reticular thalamic nucleus (nRT) receive excitatory inputs from corticothalamic and thalamocortical axons and are thus denervated by such injuries, yet nRT cells generally survive these insults to a greater degree than TCR cells. nRT cells inhibit TCR cells, regulate thalamocortical transmission, and generate cerebral rhythms including those involved in thalamocortical epilepsies. The survival and reorganization of nRT after cortical injury would determine recovery of thalamocortical circuits after injury. However, the physiological properties and connectivity of the survivors remain unknown. To study possible alterations in nRT neurons, we used the rat photothrombosis model of cortical stroke. Using in vitro patch-clamp recordings at various times after the photothrombotic injury, we show that localized strokes in the somatosensory cortex induce long-term reductions in intrinsic excitability and evoked synaptic excitation of nRT cells by the end of the first week after the injury. We find that nRT neurons in injured rats show (1) decreased membrane input resistance, (2) reduced low-threshold calcium burst responses, and (3) weaker evoked excitatory synaptic responses. Such alterations in nRT cellular excitability could lead to loss of nRT-mediated inhibition in relay nuclei, increased output of surviving TCR cells, and enhanced thalamocortical excitation, which may facilitate recovery of thalamic and cortical sensory circuits. In addition, such changes could be maladaptive, leading to injury-induced epilepsy.


Figures

Figure 1.
Figure 1.
Cortical photothrombosis. A, Brain of a rat killed 7 d after lesioning the right somatosensory cortex. Scale bars: A, B, 2 mm. B, Nissl-stained coronal slice of the corresponding brain. Note that on sectioning the cortical infarct was transformed into a vacant space extending to the subcortical white matter, but not into subcortical regions. C, Simplified diagram of the corticothalamic loop comprised of cerebral cortex, thalamocortical relay nuclei, and the nRT. (+) and (−) correspond to glutamatergic (glu) excitatory and GABAergic (GABA) inhibitory projections, respectively. Somatosensory cortical infarct results in death (black crosses) of cortical neurons and corticothalamic axons and, ultimately, by the end of the first week, in death of thalamocortical relay (TCR) cells (red cross). D, Timeline showing sequence of events. TCR cell death occurs between the fourth and the sixth days after the cortical stroke and is complete by the end of the first week (line). See Introduction for details. CT, Corticothalamic; Glu, glutamate.
Figure 2.
Figure 2.
Cell death and gliosis in the ventral posterolateral thalamic nucleus. A–F, Horizontal thalamic 50 μm sections [every 250 μm; top row (A), most dorsal; bottom row (F), most ventral] from an injured rat with combined immunolabeling for GFAP (red) and NeuN (green). The cortical infarct results, after 7 d, in death of neurons and gliosis specifically in the ipsilateral VPL thalamic relay nucleus (B2–F2). Note, on the injured side, the strong GFAP immunolabeling in VPL associated with the absence of NeuN immunolabeling (B2–F2). The most strongly affected thalamic area (D2, white box) is enlarged to reveal the localized cell loss evident in NeuN staining. Note the cell loss in VPL but not in other relay nuclei (VPM, VL, Po), nor in nRT (dashed line) (C2). The corresponding contralateral side is not affected by the injury (A1–F1). ic, Internal capsule; Po, posterior thalamic nuclear group; Str., striatum; VL, ventrolateral thalamic nucleus; VPL, ventral posterolateral thalamic nucleus; VPM, ventral posteromedial thalamic nucleus.
Figure 3.
Figure 3.
Anatomical changes in thalamus after the cortical infarct. A, Horizontal thalamic slices 7 d after the cortical infarct immunolabeled for parvalbumin (red) that labels nRT neurons and NF (green) that labels neuronal fibers. Note the parallel organization of the thalamocortical and corticothalamic fibers on the contralateral side (arrows) but disorganization and a massive loss of the fibers (crossed arrows) ipsilateral to the cortical infarct. The normally fusiform nRT somata (contralateral side) were more irregular and circular in the injured side. Note the colocalization of parvalbumin and NF immunoreactivity in somata of nRT cells as well as in the fibers on the contralateral side but not on the injured side. Scale bar, 100 μm. B, Sholl dendrite analysis of dendrite density (see Materials and Methods) by placing a series of concentric circles, spaced at 10 μm intervals centered on the somata. The number of dendritic intersections with each circle was counted. Mean (±SEM) number of intersections with each circle from four control and four injured cells is depicted. The mean values were significantly different at distances >100 μm from the soma (*p < 0.05). The Sholl diameter with the greatest number of intersections was smaller in injured cells (∼70 μm; red arrowhead) compared with controls (∼100 μm; black arrowhead), indicating an overall shrinkage of the dendritic tree. C1, C2, Reconstructed control (C1) and injured (C2) nRT cells projecting to VPL. Note the decreased dendritic and axonal length as well as a reduced number of axonal boutons in the injured nRT cell (C2) projecting to the cell-deprived VPL compared with the control nRT cell projecting to a healthy VPL (C1). D1, D2, Reconstructed control (D1) and injured (D2) nRT cells projecting to VPM. Note the decreased length and number of dendrites in the injured nRT cell as well as a strongly reduced number of axonal boutons in nRT cell projecting to the apparently noninjured VPM (D2) compared with the control nRT cell projecting to the corresponding thalamic area in the control rat (D1) (see text for details). The big axonal boutons (>0.5 μm) are indicated in black, and the small boutons (<0.5 μm) are indicated in red. ic, Internal capsule; VB, ventral-basal thalamic complex; VPL, ventral posterolateral thalamic nucleus; VPM, ventral posteromedial thalamic nucleus.
Figure 4.
Figure 4.
Effects of focal cortical infarct on electrical membrane properties of nRT neurons. A, B, Voltage responses of control (A) and injured (B) nRT thalamic neurons (top traces) to intracellular injection of positive and negative square current pulses (bottom traces). At the break of the negative current pulses, control nRT cells exhibited a large rebound response eliciting a burst of action potentials (A), which was reduced in injured nRT cells in which each burst elicited fewer action potentials (B). C1, Top, superimposition of the same amplitude voltage responses to intracellular injections of negative current pulses of −80 and −120 pA in control (black) and injured (red) cells, respectively. Note a decreased membrane input resistance and a shorter membrane time constant in the injured cell (red) compared with the control cell (black). In the injured cell, the same hyperpolarization failed to induce a rebound burst at the break of the negative current pulse. Although a rebound burst could be obtained after stronger hyperpolarization (C2), it was much less robust compared with the control cell (red injured vs black control) and elicited approximately one-half the number of APs (C2). C2, The rebound response durations as well as the number of elicited action potentials are indicated by horizontal bars and text with the corresponding color code. D, Plots of voltage (V) as a function of current intensity (I), measured from the cells shown in A and B. The apparent input resistance was measured from the linear portion of the V–I curve. Note the decreased input resistance in the injured cell compared with the control. E1, Plot of the mean firing frequency (〈F〉) as a function of current intensity. Note the decreased firing in the injured cell. E2, Voltage responses of control (black) and injured (red) nRT cells to intracellular injections of positive square current pulses. In the injured cell, much higher current intensities were required to induce similar firing rate. F, After the cortical injury, the mean membrane input resistance (R in) of nRT cells was significantly decreased (***p < 0.0005, control, n = 33 cells; vs injured, n = 26 cells) (F1), the mean membrane time constant (τm) was significantly decreased (****p < 0.0001, control, n = 33 cells; vs injured, n = 26 cells) (F2), and the membrane capacitance (C m) was unchanged (p > 0.5; control, n = 33 cells; vs injured, n = 26 cells) (F3). ns, Not significant.
Figure 5.
Figure 5.
Low-threshold calcium spikes are decreased in nRT cells after injury. A, Voltage responses (top traces) from control and injured nRT cells to intracellular injections of negative and positive square current pulses (bottom traces) from −80 mV. At the top (B), the current protocol is depicted: the negative current step of variable intensity was followed by a depolarizing current step of +100 pA inducing a burst of action potentials followed by a regular firing. Note that, for similar membrane potential hyperpolarizations, the burst firing in the injured cell was significantly reduced compared with the control cell. B, Plot of the instantaneous firing frequency (F inst) in response to a positive current step of +100 pA after a negative current step of variable intensity (see the corresponding protocol at the top). Note the accelerating–decelerating pattern in the control cell firing bursts, which was absent in the injured cell (lesion center). Also, note the relative constancy of the latency to peak frequency in the control cell (filled arrow), which became variable (open arrows) in the nRT cell far (>300 μm) from the injury (lesion far). The shortest peak latency was obtained at the break of the strongest hyperpolarization. Note the decrease in the maximal F inst (F max, dashed line) in the injured cell (∼110 Hz, lesion center) compared with the control (∼200 Hz). C, Superimposition of the normalized instantaneous frequencies (F inst) at the saturation of the maximal F inst from the cells in B. Note the reduction of the decay time constant of the F inst correlated to the distance from the injury. D, Combined Cav3.3 (red) and parvalbumin (green) immunolabeling. The intensity of both parvalbumin and Cav3.3 immunolabeling was reduced in the injured nRT cells compared with the contralateral cells from the corresponding nRT region. Cav3.3 and parvalbumin immunolabeling was colocalized in the contralateral nRT cells, but Cav3.3 expression was decreased in the injured nRT. Note the fusiform shape of contralateral cells (arrow), which was less marked in the injured nRT cells (arrowhead). Scale bar, 10 μm. F inst, Instantaneous firing frequency; F max, maximal instantaneous firing frequency; Parv, parvalbumin.
Figure 6.
Figure 6.
T-type current properties in nRT neurons after the cortical infarct. A, B, T-type current is decreased in nRT cells after injury. A1, A2, Representative nRT cell T-type current traces obtained with a SSI protocol in control (A1) and injured (A2) rats. T-currents were obtained with depolarizations to −75 mV from different holding potentials. At the bottom (A1), the voltage protocol is depicted: the holding potential was set to the indicated holding potentials for 500 ms, followed by a 100 ms hyperpolarization to −135 mV that preceded a command to −75 mV. The traces in A1 and A2 represent the currents obtained in the interval between the arrows in the indicated protocol (A1, bottom); large currents were obtained with the most hyperpolarizing prepulse potentials. A3, Normalized current amplitude plotted as a function of prepulse membrane potential (from 15 nRT cells from control rats and 10 nRT cells from injured rats) and best-fitted with a Boltzmann function (R 2 = 0.99 for both fits) (see Materials and Methods). The Boltzmann curve was shifted to the left and the half-maximal voltage (V 50%) was significantly more negative in the injured nRT cells compared with the controls (*p < 0.05). Quantitative data represent mean ± SEM. B, T-current amplitude is decreased in nRT cells after injury. B1, Superimposition of currents from injured (red) and control (black) nRT cells obtained at −75 mV after a −135 mV voltage step from the cells depicted in A1 and A2. B2, Top, The average current amplitude and current density (I ρ) (normalized by cell capacitance) of T-type calcium currents were both significantly (*p < 0.05) decreased in injured nRT cells (n = 18) compared with the controls (n = 18). B2, Bottom, The corresponding cumulative probabilities of the current amplitude and the current density were both shifted to the left (red, injured, vs black, control). C1, Normalized superimposition of the currents depicted in B1. C2, Left, Weighted decay time constant of the current was significantly (*p < 0.05) decreased in injured nRT cells (n = 18) versus the controls (n = 18). Right, The corresponding cumulative probabilities of the weighted decay time constant are shifted to the left in the injured nRT cells. Cum. prob., Cumulative probability.
Figure 7.
Figure 7.
Ba2+ restores the membrane input resistance but not the low-threshold calcium spike in the injured nRT cells. A, B, Current recordings in nRT cells from control (A) and injured (B) animals before and after application of 1 mm Ba2+. Two representative examples of nRT cells are illustrated for control (A1) and injured (B1) animals. The neurons were maintained at −75 mV and voltage steps between −65 and −135 mV were applied for 4 s at increments of 10 mV (A1, top trace). The instantaneous current (I inst) was measured at the beginning of the negative voltage step (dashed lines in A1, B1). A2, B2, Representative plots of I inst against the membrane potential (V m) before and during 1 mm Ba2+ application from a control cell (A2) and an injured cell (B2). Note the bigger effect of Ba2+ on the slope conductance of the injured cell compared with the control. C, Pooled results of membrane input resistance (R in) from five control and five injured cells recorded before and after Ba2+ application. Before Ba2+ application, R in was significantly (*p < 0.05) different in injured and control cells at both resting potential range (between −65 and −85 mV) and below −105 mV. After Ba2+ application, the R in was similar in the control and injured cells at both resting potential (between −65 and −85 mV) as well as at more hyperpolarized membrane potentials (less than −105 mV). The effect of Ba2+ on R in was four times stronger in the injured cells at both resting potential and at more hyperpolarized membrane potentials (less than −105 mV). Error bars indicate SEM. D, E, Ba2+ does not restore the LTS in the injured cells. Representative voltage responses from control (E) and injured nRT (D) cells to intracellular injections of negative square current pulses. The intensity of the current pulse is indicated below each voltage response. In control conditions, injured cells had a much lower R in compared with control cells (compare D, top trace, injured, with E, top trace, control), whereas after Ba2+ application R in was similar in control and injured cells (compare D, bottom trace, injured, with E, bottom trace, control). However, for the same level of hyperpolarization (−95 mV), the post-hyperpolarization rebound LTS observed in the control cells (E, arrow) was not observed in the injured cell (D, bottom trace).
Figure 8.
Figure 8.
Altered evoked excitatory synaptic response in nRT. A, Low-power videomicroscopic image of a horizontal slice obtained 7 d after the cortical infarct. The nRT is localized between the ventrobasal complex (VB), formed by somatosensory thalamic relay nuclei, and the internal capsule (ic), which is separated from the cortex by the striatum (Str.). Evoked responses in nRT were obtained with a concentric bipolar stimulating electrode (stim.) positioned in the adjacent ic activating glutamatergic fibers of passage from cortex or thalamus projecting to nRT. The asterisk indicates the tip of the recording electrode (e). B1, Top, Representative averaged threshold responses (n ≥ 10) from single nRT cells from control (black) and injured (red) rats. Bottom, Evoked excitatory synaptic current (EPSC) amplitudes were significantly decreased in the injured nRT cells (n = 17) versus the controls (n = 13) (****p < 0.0001). B2, Top, Normalized EPSCs depicted in B1. Bottom, Weighted decay time constant (τD,W) was significantly increased in the injured cells (n = 17) versus the controls (n = 13) (*p < 0.05). C, Altered evoked EPSC response to a train of five stimuli at 50 Hz. C1, Representative averaged responses (n ≥ 10) from single nRT cells from control (black) and injured (red) rats at 1.5× threshold. C2, Ratio of second response to first response (or PPR). Note the significant (*p < 0.05) decrease of the PPR in the injured cells (n = 10) versus the controls (n = 6). C3, Normalized EPSC amplitude plots from control (n = 6) and injured (n = 10) nRT cells during 50 Hz stimulation. The injured cells were less likely to potentiate than the control ones (C1–C3). The amplitude of the evoked EPSC was significantly decreased for each shock (*p < 0.05, injured vs control). Error bars indicate SEM. D, Representative evoked EPSPs at different potentials in nRT cells induced by a train of five stimuli at 200 Hz at 1.5× threshold in the ic. In the control cell, the synaptic stimulation induced action potential firing, which increased with membrane hyperpolarization (3 action potentials at −77 mV, 11 at −87 mV, and 13 at −95 mV), as a large LTS (arrow) crowned with high-frequency burst of action potentials was recruited. Note the less efficient summation of EPSPs in the injured cell and a decrease in the number of action potentials with hyperpolarization (2 action potentials at −76 mV, 1 at −86 mV, and 0 at −95 mV) associated with a lack of the LTS (compare D, bottom left, with bottom right traces). e, Recording electrode; EML, medullary lamina; ic, internal capsule; stim. stimulating electrode; Str., striatum; VB, ventral-basal thalamic complex.
Figure 9.
Figure 9.
Spontaneous synaptic activity in nRT is not altered after cortical infarct. A1, Spontaneous EPSC recordings from representative nRT neurons from control (top) and injured (bottom) rats. A2, Left, Ensemble averaged EPSCs from representative nRT cells from control (black) and injured (red) rats, plotted on the same time scale. A3, Right, Cumulative probability histograms of >1500 isolated events from control (n = 19 neurons) and injured (n = 16) neurons demonstrate no significant changes in amplitude and kinetics. B1, Spontaneous IPSC recordings from representative nRT cells from control (top traces) and injured (bottom traces) rats. B2, Ensemble averaged IPSCs from representative nRT cells from control (black) and injured (red) rats, plotted on the same timescale. B3, Cumulative probability histograms of isolated events from control (n = 28 cells; 2599 events) and injured (n = 19 cells; 1858 events) animals demonstrate no significant changes in amplitude and kinetics (p > 0.05). B4, Left, Superimposition of averaged IPSCs from representative nRT cells evoked by intra-nRT stimulation (see Materials and Methods). Right, Statistical graphs from control (n = 12) and injured (n = 7) nRT cells demonstrating no significant change in amplitude (p > 0.7, control vs injured) and kinetics (p > 0.9, control vs injured) of the evoked IPSC. Ampl., Amplitude; Cum. prob., cumulative probability; ns, not significant.

Similar articles

Cited by

References

    1. Abbas SY, Ying SW, Goldstein PA. Compartmental distribution of hyperpolarization-activated cyclic-nucleotide-gated channel 2 and hyperpolarization-activated cyclic-nucleotide-gated channel 4 in thalamic reticular and thalamocortical relay neurons. Neuroscience. 2006;141:1811–1825. - PubMed
    1. Agarwala S, Kalil RE. Axotomy-induced neuronal death and reactive astrogliosis in the lateral geniculate nucleus following a lesion of the visual cortex in the rat. J Comp Neurol. 1998;392:252–263. - PubMed
    1. Avanzini G, de Curtis M, Panzica F, Spreafico R. Intrinsic properties of nucleus reticularis thalami neurones of the rat studied in vitro . J Physiol. 1989;416:111–122. - PMC - PubMed
    1. Bal T, McCormick DA. Mechanisms of oscillatory activity in guinea-pig nucleus reticularis thalami in vitro: a mammalian pacemaker. J Physiol. 1993;468:669–691. - PMC - PubMed
    1. Bal T, von Krosigk M, McCormick DA. Role of the ferret perigeniculate nucleus in the generation of synchronized oscillations in vitro. J Physiol. 1995;483:665–685. - PMC - PubMed

Publication types

MeSH terms