

Extraction of individual muscle mechanical action from endpoint force
- PMID: 20393065
- PMCID: PMC2888544
- DOI: 10.1152/jn.00956.2009
Extraction of individual muscle mechanical action from endpoint force
Abstract
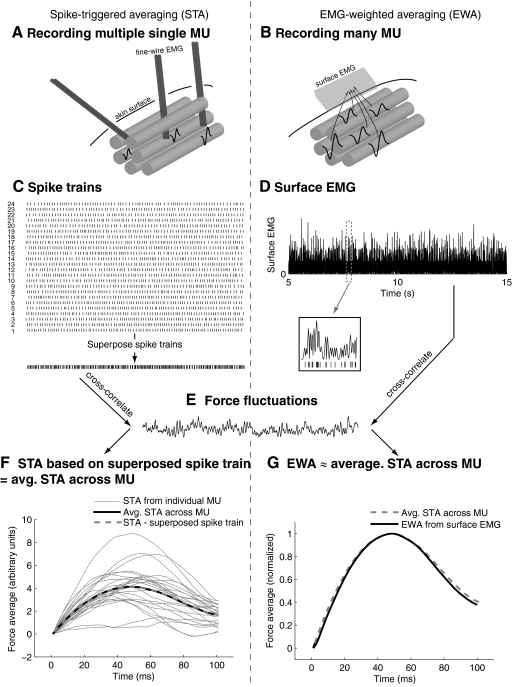
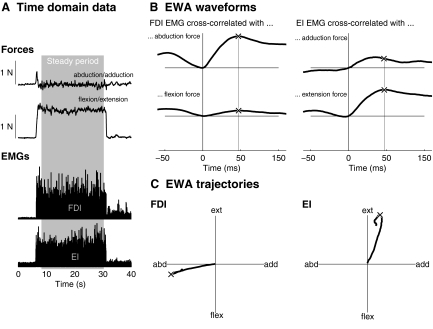
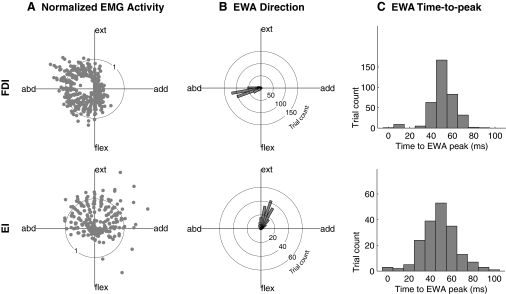
Most motor tasks require the simultaneous coordination of multiple muscles. That coordination is poorly understood in part because there is no noninvasive means of isolating a single muscle's contribution to the resultant endpoint force. The contribution of a single motor unit to isometric tasks can, however, be characterized using the spike-triggered averaging (STA) technique, applied to a single motor unit's spike train. We propose that a technique analogous to STA, which we call electromyogram (EMG)-weighted averaging (EWA), can be applied to surface EMGs to extract muscle mechanical action from the natural endpoint force fluctuations generated during steady isometric contraction. We demonstrate this technique on simultaneous recordings of fingertip force and surface EMG from the first dorsal interosseous (FDI) and extensor indicis (EI) of humans. The EWA direction was approximately the same across a wide range of fingertip force directions, and the average EWA direction was consistent with mechanical action direction of these muscles estimated from cadaveric and imaging data: the EWA directions were 193 +/- 2 degrees for the FDI and 71 +/- 5 degrees for the EI (95% confidence). EWA transient behavior also appears to capture temporal characteristics of muscle force fluctuations with peak force time and general waveform shape similar to that of the associated spike-triggered averages from single motor units. The EWA may provide a means of empirically characterizing the complex transformation between muscle force and endpoint force without the need for invasive electrode recordings or complex anatomical measurements of musculoskeletal geometry.
Figures
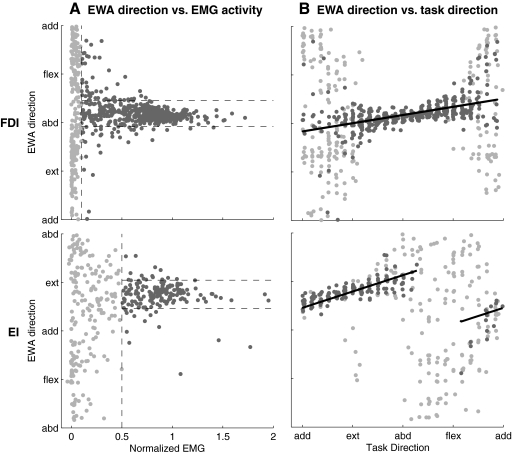
 ) trials. A linear fit (—) to the above-threshold trials illustrates small but predictable shifts in EWA direction with changes in task direction.
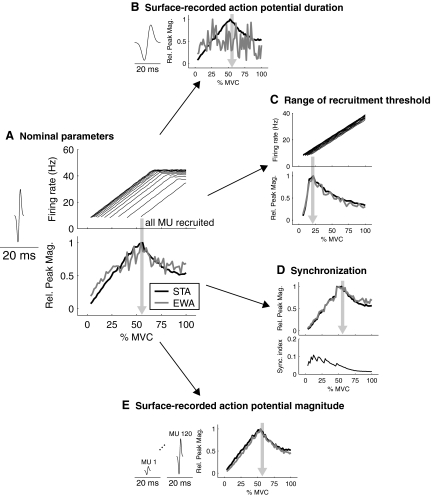
Similar articles
-
Limitations of the spike-triggered averaging for estimating motor unit twitch force: a theoretical analysis.PLoS One. 2014 Mar 25;9(3):e92390. doi: 10.1371/journal.pone.0092390. eCollection 2014. PLoS One. 2014. PMID: 24667744 Free PMC article.
-
Extraocular muscle motor units characterized by spike-triggered averaging in alert monkey.J Neurosci Methods. 2012 Feb 15;204(1):159-167. doi: 10.1016/j.jneumeth.2011.11.012. Epub 2011 Nov 15. J Neurosci Methods. 2012. PMID: 22108141 Free PMC article.
-
Amplitude cancellation of motor-unit action potentials in the surface electromyogram can be estimated with spike-triggered averaging.J Neurophysiol. 2008 Jul;100(1):431-40. doi: 10.1152/jn.90365.2008. Epub 2008 May 7. J Neurophysiol. 2008. PMID: 18463179 Free PMC article.
-
Motor-unit synchronization alters spike-triggered average force in simulated contractions.J Neurophysiol. 2002 Jul;88(1):265-76. doi: 10.1152/jn.2002.88.1.265. J Neurophysiol. 2002. PMID: 12091552
-
Using spike-triggered averaging to characterize motor unit twitch vectors in the first dorsal interosseous.Annu Int Conf IEEE Eng Med Biol Soc. 2012;2012:3604-7. doi: 10.1109/EMBC.2012.6346746. Annu Int Conf IEEE Eng Med Biol Soc. 2012. PMID: 23366707
Cited by
-
Limitations of the spike-triggered averaging for estimating motor unit twitch force: a theoretical analysis.PLoS One. 2014 Mar 25;9(3):e92390. doi: 10.1371/journal.pone.0092390. eCollection 2014. PLoS One. 2014. PMID: 24667744 Free PMC article.
-
Decrease in muscle contraction time complements neural maturation in the development of dynamic manipulation.J Neurosci. 2013 Sep 18;33(38):15050-5. doi: 10.1523/JNEUROSCI.1968-13.2013. J Neurosci. 2013. PMID: 24048835 Free PMC article.
-
Robust and accurate decoding of motoneuron behaviour and prediction of the resulting force output.J Physiol. 2018 Jul;596(14):2643-2659. doi: 10.1113/JP276153. Epub 2018 Jun 9. J Physiol. 2018. PMID: 29726002 Free PMC article.
-
Dual dimensionality reduction reveals independent encoding of motor features in a muscle synergy for insect flight control.PLoS Comput Biol. 2015 Apr 28;11(4):e1004168. doi: 10.1371/journal.pcbi.1004168. eCollection 2015 Apr. PLoS Comput Biol. 2015. PMID: 25919482 Free PMC article.
-
Action Direction of Muscle Synergies in Three-Dimensional Force Space.Front Bioeng Biotechnol. 2015 Nov 13;3:187. doi: 10.3389/fbioe.2015.00187. eCollection 2015. Front Bioeng Biotechnol. 2015. PMID: 26618156 Free PMC article.
References
-
- An KN, Ueba Y, Chao EY, Cooney WP, Linscheid RL. Tendon excursion and moment arm of index finger muscles. J Biomechan 16: 419–425, 1983 - PubMed
-
- Berens P. Circstat: a matlab toolbox for circular statistics. J Stat Software 31: 1–21, 2009
-
- Binder MD, Powers RK. Relationship between simulated common synaptic input and discharge synchrony in cat spinal motoneurons. J Neurophysiol 86: 2266–2275, 2001 - PubMed
-
- Blaschak MJ, Powers RK, Rymer WZ. Disturbances of motor output in a cat hindlimb muscle after acute dorsal spinal hemisection. Exp Brain Res 71: 377–387, 1988 - PubMed
Publication types
MeSH terms
Grants and funding
LinkOut - more resources
Full Text Sources
Miscellaneous