

A prospective analysis of elevated fasting glucose levels and cognitive function in older people: results from PROSPER and the Rotterdam Study
- PMID: 20393152
- PMCID: PMC2889758
- DOI: 10.2337/db09-0568
A prospective analysis of elevated fasting glucose levels and cognitive function in older people: results from PROSPER and the Rotterdam Study
Abstract
Objective: To investigate the relationship between fasting glucose levels, insulin resistance, and cognitive impairment in old age. Diabetes is associated with cognitive impairment in older people. However, the link between elevated fasting glucose levels and insulin resistance in nondiabetic individuals, and the risk of cognitive impairment is unclear.
Research design and methods: We analyzed data from, in total, 8,447 participants in two independent prospective studies: the PROspective Study of Pravastatin in the Elderly at Risk (PROSPER), 5,019 participants, aged 69-84 years, and the Rotterdam Study, 3,428 participants, aged 61-97 years. Fasting glucose levels were assessed at baseline in both studies; fasting insulin levels were assessed in the Rotterdam Study only. Cognitive function was assessed in both studies at baseline and during follow-up.
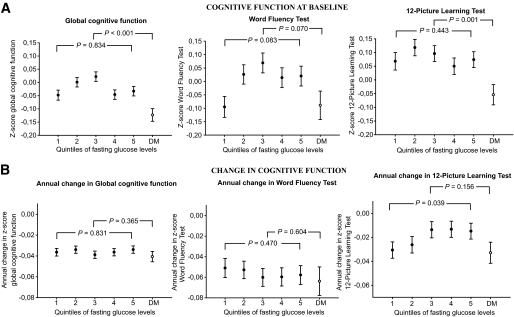
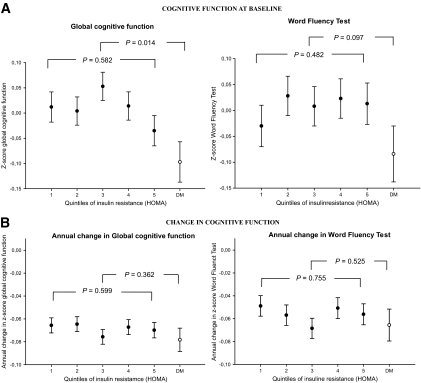
Results: Subjects with diabetes had impaired cognitive function at baseline. In contrast, in people without a history of diabetes, there was no clear association between baseline fasting glucose levels and executive function and memory, nor was there a consistent relationship between elevated baseline fasting glucose levels and the rate of cognitive decline in either cohort. Insulin resistance (homeostasis model assessment index) was also unrelated to cognitive function and decline.
Conclusions: Elevated fasting glucose levels and insulin resistance are not associated with worse cognitive function in older people without a history of diabetes. These data suggest either that there is a threshold for effects of dysglycemia on cognitive function or that factors other than hyperglycemia contribute to cognitive impairment in individuals with frank diabetes.
Figures
Similar articles
-
Impaired fasting glucose is associated with increased arterial stiffness in elderly people without diabetes mellitus: the Rotterdam Study.J Am Geriatr Soc. 2006 Mar;54(3):397-404. doi: 10.1111/j.1532-5415.2005.00614.x. J Am Geriatr Soc. 2006. PMID: 16551305
-
Diabetes, impaired fasting glucose, and cognitive decline in a population of elderly community residents.Aging Clin Exp Res. 2012 Aug;24(4):377-83. doi: 10.1007/BF03325269. Aging Clin Exp Res. 2012. PMID: 23238313
-
Associations of statin use with glycaemic traits and incident type 2 diabetes.Br J Clin Pharmacol. 2019 May;85(5):993-1002. doi: 10.1111/bcp.13898. Epub 2019 Mar 18. Br J Clin Pharmacol. 2019. PMID: 30838685 Free PMC article.
-
Molecular mechanisms underlying hyperglycemia associated cognitive decline.IBRO Neurosci Rep. 2022 Dec 13;14:57-63. doi: 10.1016/j.ibneur.2022.12.006. eCollection 2023 Jun. IBRO Neurosci Rep. 2022. PMID: 36590246 Free PMC article. Review.
-
Impaired fasting glucose, oxidative distress, and cognitive impairment. Is this the starting point on DBT cognitive decline?Front Aging Neurosci. 2022 Jul 26;14:911331. doi: 10.3389/fnagi.2022.911331. eCollection 2022. Front Aging Neurosci. 2022. PMID: 35959297 Free PMC article. Review.
Cited by
-
Age-related hyperinsulinemia leads to insulin resistance in neurons and cell-cycle-induced senescence.Nat Neurosci. 2019 Nov;22(11):1806-1819. doi: 10.1038/s41593-019-0505-1. Epub 2019 Oct 21. Nat Neurosci. 2019. PMID: 31636448
-
Different risk factors for cognitive impairment among community-dwelling elderly, with impaired fasting glucose or diabetes.Diabetes Metab Syndr Obes. 2019 Jan 9;12:121-130. doi: 10.2147/DMSO.S180781. eCollection 2019. Diabetes Metab Syndr Obes. 2019. PMID: 30666140 Free PMC article.
-
Impact of glycemic status on longitudinal cognitive performance in men with and without HIV infection.AIDS. 2018 Aug 24;32(13):1849-1860. doi: 10.1097/QAD.0000000000001842. AIDS. 2018. PMID: 29746300 Free PMC article.
-
The Rotterdam Study: 2014 objectives and design update.Eur J Epidemiol. 2013 Nov;28(11):889-926. doi: 10.1007/s10654-013-9866-z. Epub 2013 Nov 21. Eur J Epidemiol. 2013. PMID: 24258680
-
Insulin sensitivity predicts cognitive decline in individuals with prediabetes.BMJ Open Diabetes Res Care. 2020 Nov;8(2):e001741. doi: 10.1136/bmjdrc-2020-001741. BMJ Open Diabetes Res Care. 2020. PMID: 33203727 Free PMC article.
References
-
- Biessels GJ, Staekenborg S, Brunner E, Brayne C, Scheltens P: Risk of dementia in diabetes mellitus: a systematic review. Lancet Neurol 2006;5:64–74 - PubMed
-
- Münch G, Schinzel R, Loske C, Wong A, Durany N, Li JJ, Vlassara H, Smith MA, Perry G, Riederer P: Alzheimer's disease—synergistic effects of glucose deficit, oxidative stress and advanced glycation endproducts. J Neural Transm 1998;105:439–461 - PubMed
-
- Craft S: Insulin resistance syndrome and Alzheimer's disease: age- and obesity-related effects on memory, amyloid, and inflammation. Neurobiol Aging 2005;26(Suppl. 1):65–69 - PubMed
-
- Lindahl B, Weinehall L, Asplund K, Hallmans G: Screening for impaired glucose tolerance. Results from a population-based study in 21,057 individuals. Diabetes Care 1999;22:1988–1992 - PubMed
-
- Expert Committee on the Diagnosis and Classification of Diabetes Mellitus. Report of the expert committee on the diagnosis and classification of diabetes mellitus. Diabetes Care 2003;26(Suppl. 1):S5–S20 - PubMed
Publication types
MeSH terms
Substances
LinkOut - more resources
Full Text Sources
Medical
