Clinical Trial
. 2010 Apr 14;2(27):27ra27.
doi: 10.1126/scitranslmed.3000619.

A bihormonal closed-loop artificial pancreas for type 1 diabetes

Affiliations
Clinical Trial

A bihormonal closed-loop artificial pancreas for type 1 diabetes

Firas H El-Khatib et al. Sci Transl Med. .

Abstract

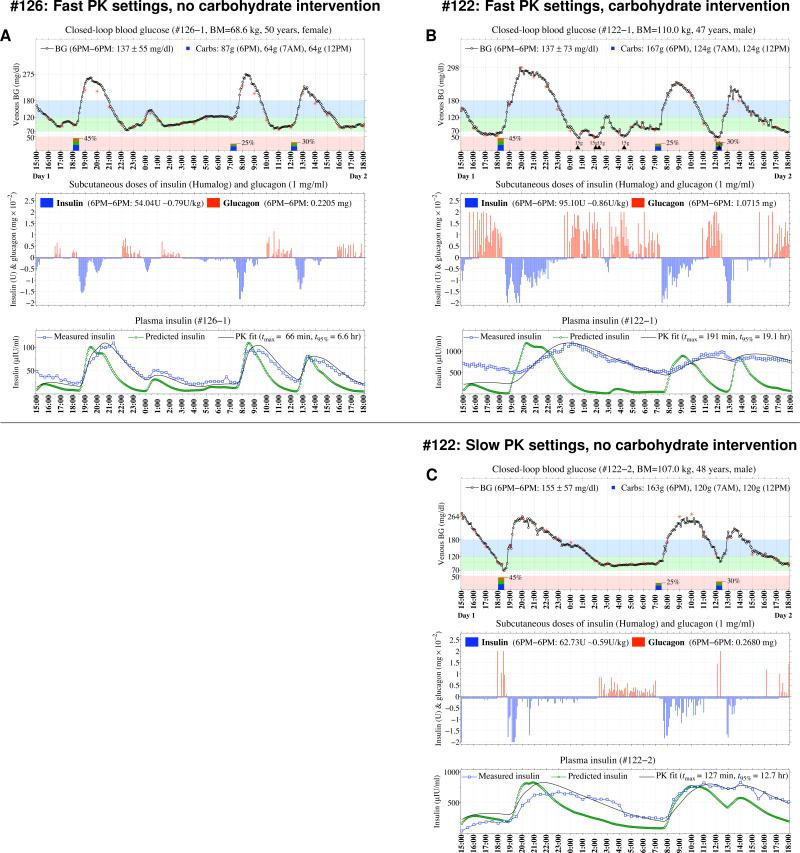
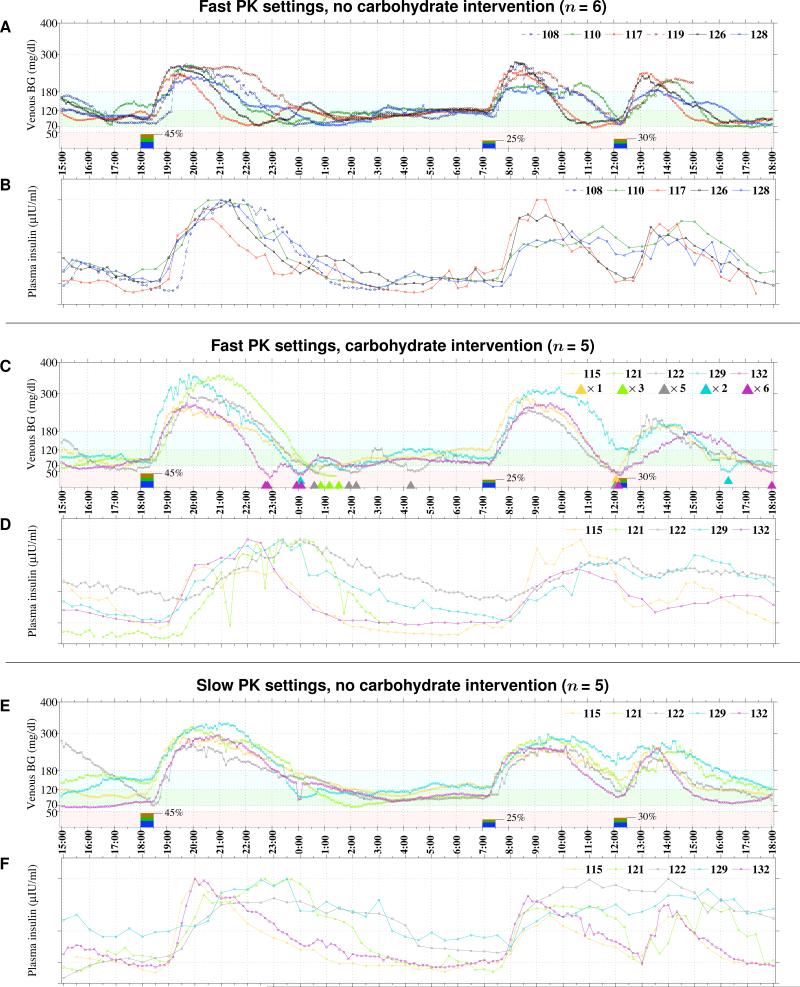
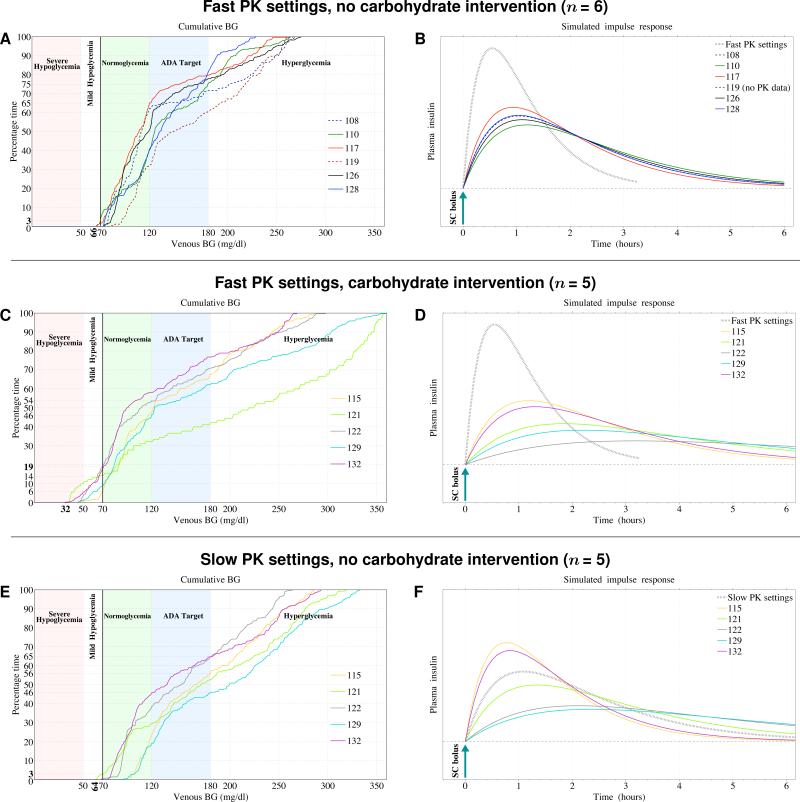
Automated control of blood glucose (BG) concentration is a long-sought goal for type 1 diabetes therapy. We have developed a closed-loop control system that uses frequent measurements of BG concentration along with subcutaneous delivery of both the fast-acting insulin analog lispro and glucagon (to imitate normal physiology) as directed by a computer algorithm. The algorithm responded only to BG concentrations and incorporated a pharmacokinetic model for lispro. Eleven subjects with type 1 diabetes and no endogenous insulin secretion were studied in 27-hour experiments, which included three carbohydrate-rich meals. In six subjects, the closed-loop system achieved a mean BG concentration of 140 mg/dl, which is below the mean BG concentration target of < or =154 mg/dl recommended by the American Diabetes Association. There were no instances of treatment-requiring hypoglycemia. Five other subjects exhibited hypoglycemia that required treatment; however, these individuals had slower lispro absorption kinetics than the six subjects that did not become hypoglycemic. The time-to-peak plasma lispro concentrations of subjects that exhibited hypoglycemia ranged from 71 to 191 min (mean, 117 +/- 48 min) versus 56 to 72 min (mean, 64 +/- 6 min) in the group that did not become hypoglycemic (aggregate mean of 84 min versus 31 min longer than the algorithm's assumption of 33 min, P = 0.07). In an additional set of experiments, adjustment of the algorithm's pharmacokinetic parameters (time-to-peak plasma lispro concentration set to 65 min) prevented hypoglycemia in both groups while achieving an aggregate mean BG concentration of 164 mg/dl. These results demonstrate the feasibility of safe BG control by a bihormonal artificial endocrine pancreas.


Figures

Figure 1
Figure 1. Representative Results from Three Closed-Loop Blood Glucose Control Experiments in Two Subjects
Venous BG levels measured every 5 minutes with the GlucoScout™ (black circles) are shown in the top graph of Panel A for one of the six subjects who did not develop treatment-requiring hypoglycemia and, in retrospect, had relatively fast insulin lispo PK, and in the top graph of Panel B for one of the five subjects who required multiple 15-g carbohydrate treatments for hypoglycemia (indicated along the timeline by black triangles) and had slower lispro PK. Hourly confirmation values (red stars) obtained with the YSI are superimposed on the BG trace and meals are indicated along the timeline by rectangles with the percentage of daily calories of each meal indicated. Results from the repeat closed-loop experiment for the subject in Panel B using the slower PK parameter settings is shown in Panel C. The middle graph in each panel shows each bolus of insulin (vertical blue bars with negative amplitudes) and glucagon (vertical red bars with positive amplitudes) issued by the algorithm. The bottom graph in each panel shows the model-estimated (green circles) and measured (blue squares) insulin levels. The black line is the best fit of the bi-exponential PK model to the measured insulin levels (see Supplementary Appendix for further details).
Figure 2
Figure 2. Blood Glucose and Plasma Insulin Levels from Closed-Loop BG Control Experiments in All 11 Subjects.
Venous BG and measured insulin lispro levels are shown, respectively, in Panels A and B for the six subjects who did not develop treatment-requiring hypoglycemia, and in Panels C and D for the five subjects who required one or more carbohydrate treatments for hypoglycemia during the initial experiments using the controller configured with the fast lispro PK parameter settings (tmax=33 min), and in Panels E and F for the repeat experiments using the controlle configured with the slow PK setting (tmax=65 min). Each 15-g carbohydrate intervention for hypoglycemia is indicated along the timeline in Panel C with a color-coded triangle.
Figure 3
Figure 3. Cumulative BG Levels and Lispro PK from Closed-Loop BG Control Experiments in All 11 Subjects
Cumulative venous BG levels are shown in Panel A for the six subjects who did not develop treatment-requiring hypoglycemia, and in Panel C for the five subjects who required one or more carbohydrate treatments for hypoglycemia during the initial experiments using the controller configured with the fast lispro PK parameter settings (tmax=33 min), and in Panel E for the repeat experiments using the controller configured with the slow PK settings (tmax=65 min). Shown in parallel with Panels A, C, and E are the corresponding graphical representations of each subjects’ simulated insulin profiles (Panels B, D, and E) derived, retrospectively, from the measured lispro levels in Panels A, C, and E and portrayed as the lispro levels after a single insulin bolus (see Supplementary Appendix for further details). Whereas the fast PK parameter settings resulted in model-estimated PK that was faster than any subject's measured PK (Panels B and D), the slow PK parameter settings resulted in model-estimated PK that fell between the fastest and slowest subjects’ measured PK in the repeat experiments (Panel F). When the measured insulin PK (solid curves in Panels B and F) was closer to the model-estimated PK used by the control algorithm (black hatched curve in Panels B and F), the time spent in the ADA glycemic target range was greater, with no treatment-requiring hypoglycemia (Panels A and E); however, when the measured insulin levels were discrepant from the model-estimated PK used by the control algorithm (Panel D), blood glucose levels were both higher and lower than the ADA target range with hypoglycemia requiring intervention (Panel C).

Comment in

Similar articles

Cited by

References

    1. The effect of intensive treatment of diabetes on the development and progression of long-term complications in insulin-dependent diabetes mellitus. The Diabetes Control and Complications Trial Research Group. N Engl J Med. 1993;329(14):977–86. - PubMed
    1. Retinopathy and nephropathy in patients with type 1 diabetes four years after a trial of intensive therapy. The Diabetes Control and Complications Trial/Epidemiology of Diabetes Interventions and Complications Research Group. N Engl J Med. 2000;342(6):381–9. - PMC - PubMed
    1. Effect of intensive therapy on the microvascular complications of type 1 diabetes mellitus. Jama. 2002;287(19):2563–9. - PMC - PubMed
    1. Nathan DM, Cleary PA, Backlund JY, et al. Intensive diabetes treatment and cardiovascular disease in patients with type 1 diabetes. N Engl J Med. 2005;353(25):2643–53. - PMC - PubMed
    1. Standards of medical care in diabetes--2009. Diabetes Care. 2009;32(Suppl 1):S13–61. - PMC - PubMed

Publication types

MeSH terms