. 2010 May 13;465(7295):182-7.
doi: 10.1038/nature09033. Epub 2010 Apr 14.

Widespread transcription at neuronal activity-regulated enhancers

Affiliations

Widespread transcription at neuronal activity-regulated enhancers

Tae-Kyung Kim et al. Nature. .

Abstract

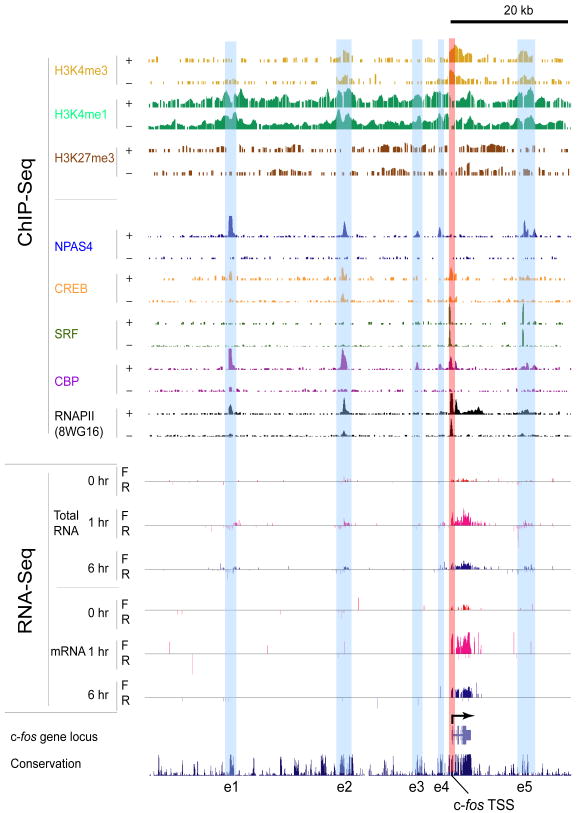
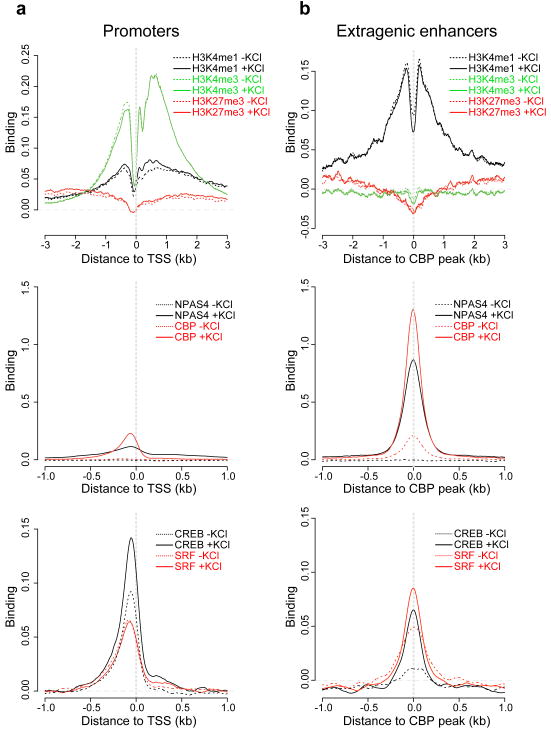
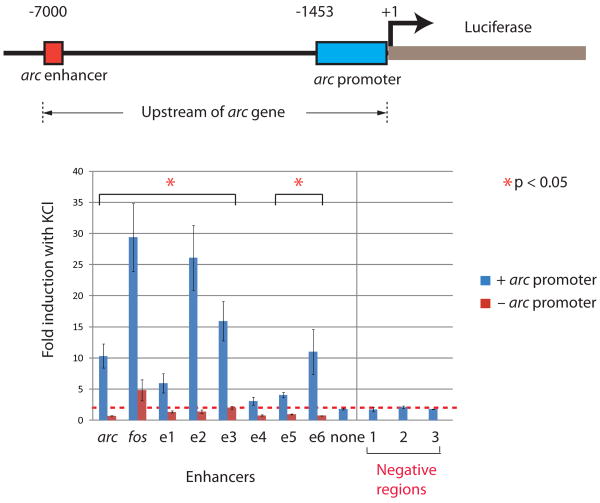
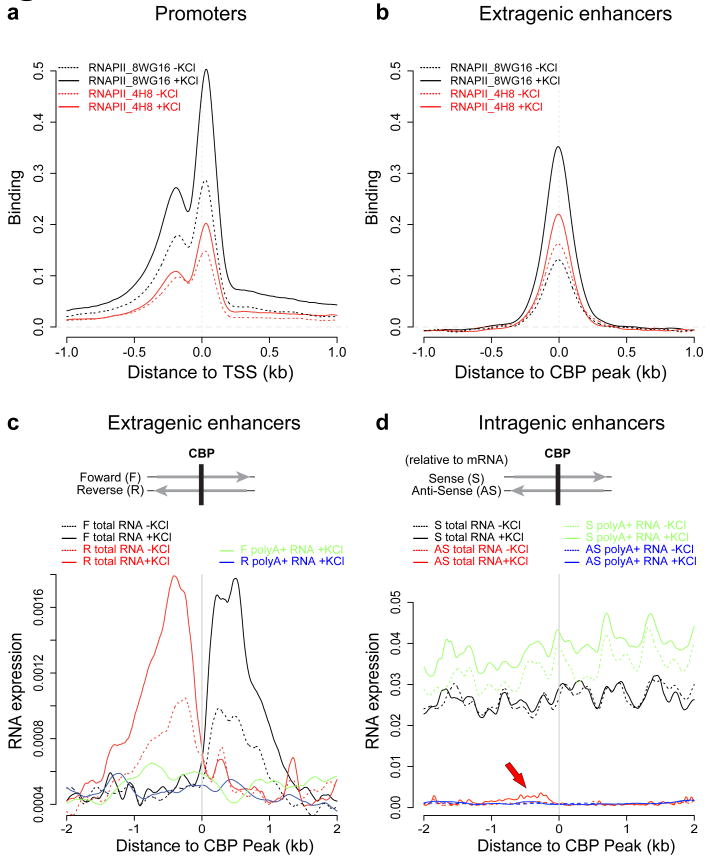
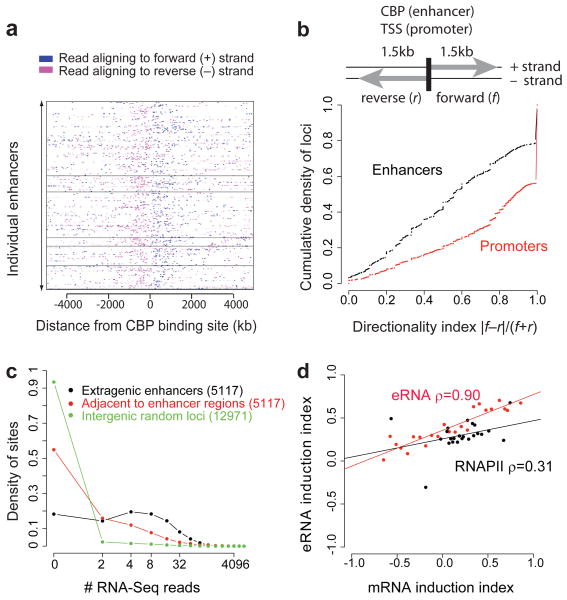
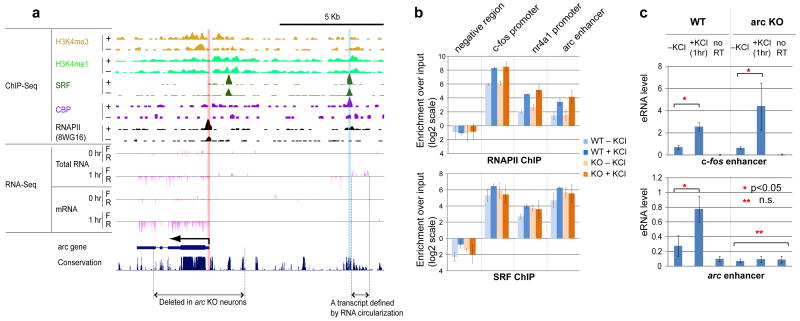
We used genome-wide sequencing methods to study stimulus-dependent enhancer function in mouse cortical neurons. We identified approximately 12,000 neuronal activity-regulated enhancers that are bound by the general transcriptional co-activator CBP in an activity-dependent manner. A function of CBP at enhancers may be to recruit RNA polymerase II (RNAPII), as we also observed activity-regulated RNAPII binding to thousands of enhancers. Notably, RNAPII at enhancers transcribes bi-directionally a novel class of enhancer RNAs (eRNAs) within enhancer domains defined by the presence of histone H3 monomethylated at lysine 4. The level of eRNA expression at neuronal enhancers positively correlates with the level of messenger RNA synthesis at nearby genes, suggesting that eRNA synthesis occurs specifically at enhancers that are actively engaged in promoting mRNA synthesis. These findings reveal that a widespread mechanism of enhancer activation involves RNAPII binding and eRNA synthesis.


Figures

Figure 1
Figure 1. Enhancers near the c-fos gene with increased CBP/RNAPII/NPAS4 binding and eRNA production upon membrane depolarization
ChIP-Seq: for each histone modification or transcription factor (TF), two horizontal rows display the numbers of input-normalized ChIP-Seq reads across the locus, with “+” and “−” denoting the membrane-depolarized (2 hours KCl) and unstimulated conditions, respectively. RNA-Seq: for each of 0, 1, or 6 hours of membrane-depolarization, the numbers of reads aligning to forward (F) and reverse (R) genomic strands are separately displayed. Enhancers identified in this study are highlighted by light-blue vertical bars (e1–e5), and the promoter region of c-fos gene is shown by a vertical light-red bar.
Figure 2
Figure 2. Comparison of binding profiles between promoters and neuronal activity-regulated enhancers
Binding profiles of methylated histones and TFs at the promoter transcription start sites (TSSs) of 25,562 annotated genes (a) versus 5,117 extragenic enhancers (b). In each panel, binding profiles of methylated histones (top), CBP and NPAS4 (middle), and CREB and SRF (bottom) from unstimulated and membrane-depolarized (2 hours KCl) neurons are shown. The y-axes denote the degree of binding averaged across all promoters or enhancers, expressed as the mean number of input-normalized ChIP-Seq reads. Promoters are aligned at their annotated TSSs, and enhancers are aligned at their CBP binding sites, with the x-axes indicating the distance (kb) to either the TSS or the CBP site.
Figure 3
Figure 3. Activty-induced luciferase expression mediated by neuronal enhancers
The arc enhancer was replaced by various neuronal enhancers in the context of the ∼7 kb region upstream of the arc gene. The resulting fragments were placed upstream of a luciferase reporter gene, and activity-dependent expression of luciferase was measured in the presence or absence of the arc proximal promoter after six hours KCl treatment. In additional control experiments, the arc enhancer was removed, or three randomly chosen extragenic loci that do not show enhancer features were inserted. The red dotted line indicates the mean induction value of the three negative regions tested. Error bars, s.e.m (n=3 biological replicates); p-value from t-test.
Figure 4
Figure 4. Enhancers bind RNA Polymerase II (RNAPII) and produce eRNAs
a, Binding profile of RNAPII at 25,562 TSSs of annotated genes using two different anti-RNAPII antibodies (8WG16 or 4H8). b, Binding profile of RNAPII at 5,117 extragenic enhancers. c-d, Profile of RNA expression at extragenic enhancers (c) and at 6,718 intragenic enhancers (d) based on RNA sequencing of the total RNA and polyA+ RNA fractions. The y-axes report RNA expression as the normalized number of RNA-Seq reads per bp (Methods). In (c), F and R denote forward (+) and reverse (-) genomic strands. In (d), enhancers are aligned oriented relative to the gene in which they reside to allow for sense and anti-sense RNA-Seq reads to be shown separately. While sense eRNAs cannot be detected due to overlapping mRNA transcription, the red arrow indicates a local increase in anti-sense RNA expression attributable to eRNAs (statistics in Methods). Note different scales on the y-axis in (c) and (d).
Figure 5
Figure 5. eRNAs are transcribed bidirectionally, and their activity-dependent induction correlates with induction of nearby genes
a, RNA expression at 315 extragenic enhancers. The enhancers are grouped into six categories using k-means clustering based on eRNA, RNAPII, CBP, NPAS4, CREB, SRF, and H3K4me1 levels with categories separated by horizontal black lines. b, Directional bias of transcription initiated from enhancers and promoters, where f and r represent the numbers of reads aligning to the regions indicated (see Methods). c, The distribution of the number of RNA-Seq reads found within 1.5 kb of the extragenic enhancer loci, adjacent regions, and random regions (see Methods). d, Changes in RNAPII binding and eRNA levels at extragenic enhancers versus changes in mRNA expression levels of nearby genes upon membrane depolarization. Each dot represents a set of genes that have similar mRNA induction indices and a corresponding set of enhancers nearby those genes (see Methods). The lines are the best linear fits to the points, and ρ is the Spearman correlation coefficient.
Figure 6
Figure 6. eRNA synthesis but not RNAPII binding at the arc enhancer requires the presence of the arc promoter
a, The mouse arc genomic locus with ChIP-Seq and RNA-Seq data as in Fig. 1. Also shown are the region deleted in the arc knock-out (arc KO) mouse and a non-polyadenylated eRNA transcript defined by the RNA circularization method (Methods). b, Binding profiles of RNAPII and SRF at various loci determined by ChIP-qPCR from both WT and arc KO neurons. Error bars, s.e.m. (n=2 biological replicates) c. RT-qPCR detection of the presence of eRNAs from WT and arc KO neurons. No RT represents the qPCR signal from cDNA samples generated from reactions in which reverse transcriptase was omitted. Error bars are s.e.m. (n=3 bioloigical replicates); p-values are from the t-test.

Comment in

Similar articles

Cited by

References

    1. Banerji J, Rusconi S, Schaffner W. Expression of a beta-globin gene is enhanced by remote SV40 DNA sequences. Cell. 1981;27(2 Pt 1):299–308. - PubMed
    1. Greer PL, Greenberg ME. From synapse to nucleus: calcium-dependent gene transcription in the control of synapse development and function. Neuron. 2008;59(6):846–860. - PubMed
    1. Heintzman ND, et al. Distinct and predictive chromatin signatures of transcriptional promoters and enhancers in the human genome. Nat Genet. 2007;39(3):311–318. - PubMed
    1. Visel A, et al. ChIP-seq accurately predicts tissue-specific activity of enhancers. Nature. 2009;457(7231):854–858. - PMC - PubMed
    1. Xi H, et al. Identification and characterization of cell type-specific and ubiquitous chromatin regulatory structures in the human genome. PLoS Genet. 2007;3(8):e136. - PMC - PubMed

Publication types

MeSH terms

Associated data