. 2010 Apr 15;464(7291):1039-42.
doi: 10.1038/nature08923.

Dissection of genetically complex traits with extremely large pools of yeast segregants

Affiliations

Dissection of genetically complex traits with extremely large pools of yeast segregants

Ian M Ehrenreich et al. Nature. .

Abstract

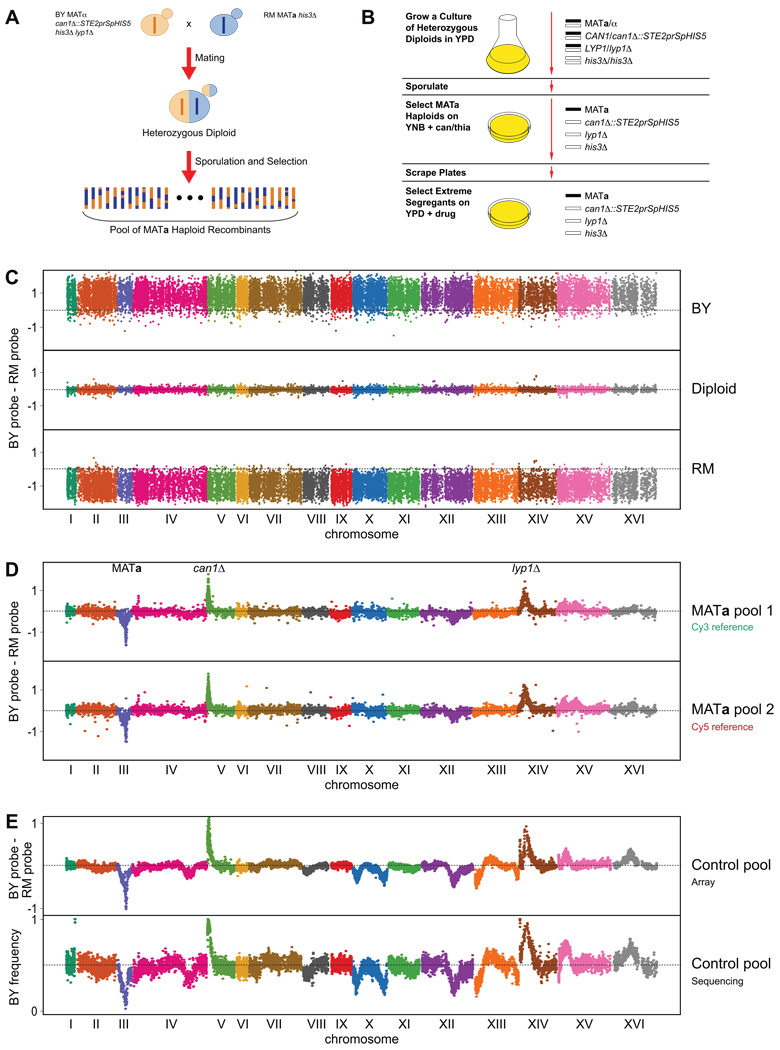
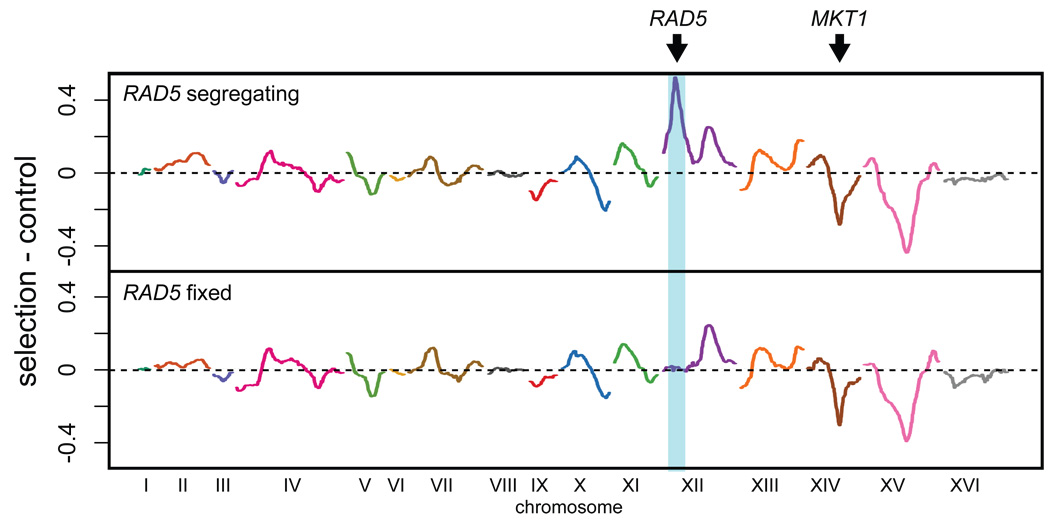
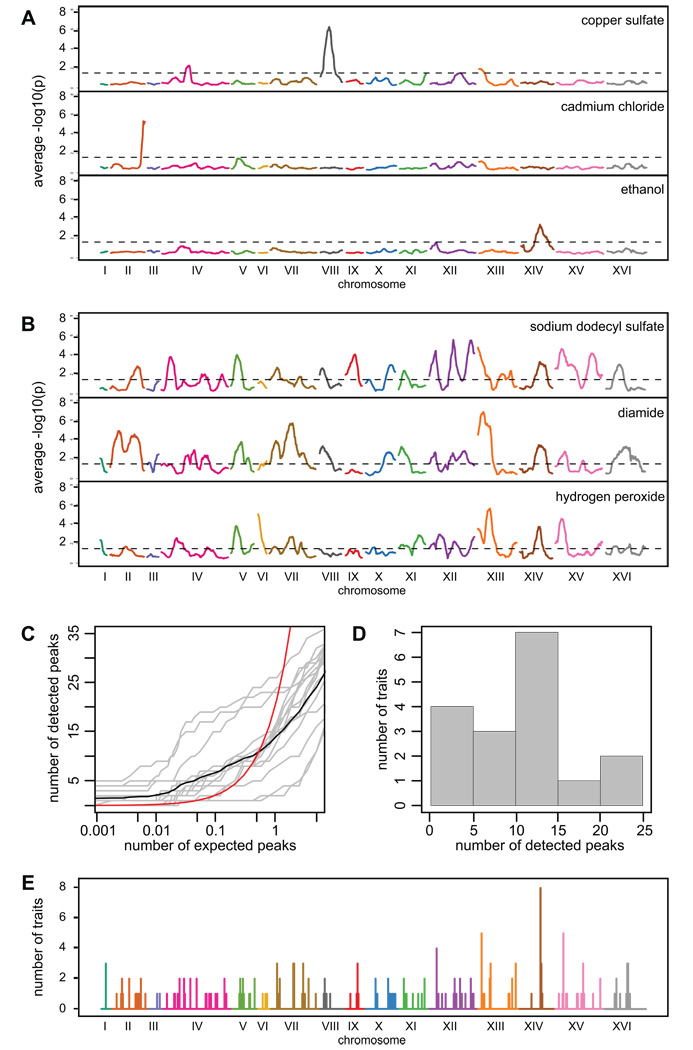
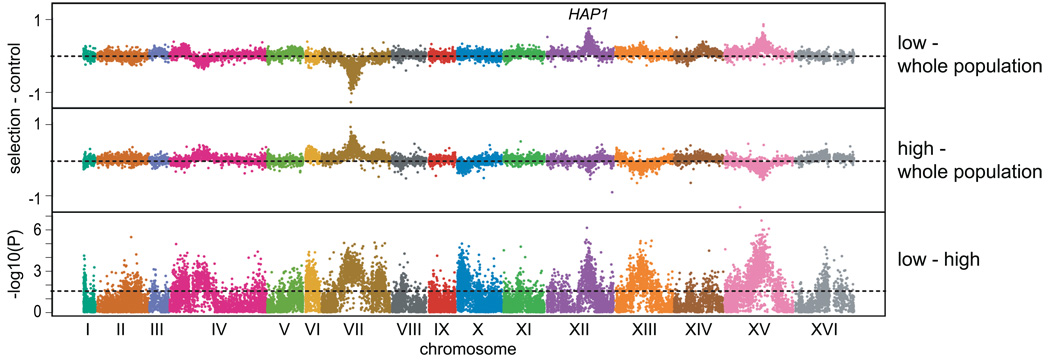
Most heritable traits, including many human diseases, are caused by multiple loci. Studies in both humans and model organisms, such as yeast, have failed to detect a large fraction of the loci that underlie such complex traits. A lack of statistical power to identify multiple loci with small effects is undoubtedly one of the primary reasons for this problem. We have developed a method in yeast that allows the use of much larger sample sizes than previously possible and hence permits the detection of multiple loci with small effects. The method involves generating very large numbers of progeny from a cross between two Saccharomyces cerevisiae strains and then phenotyping and genotyping pools of these offspring. We applied the method to 17 chemical resistance traits and mitochondrial function, and identified loci for each of these phenotypes. We show that the level of genetic complexity underlying these quantitative traits is highly variable, with some traits influenced by one major locus and others by at least 20 loci. Our results provide an empirical demonstration of the genetic complexity of a number of traits and show that it is possible to identify many of the underlying factors using straightforward techniques. Our method should have broad applications in yeast and can be extended to other organisms.


Figures

Figure 1
Figure 1. X-QTL design and quantitative allele frequency measurement in DNA pools
The crossing design used for X-QTL is shown in (A), while the selection scheme used to generate segregating pools is shown in (B). Genotyping of parental strains (C), two segregating pools (D), and an unselected control pool grown on rich medium (E). Dashed lines at zero indicate no difference between the BY and RM allele-specific probes. Enrichment of the BY allele is indicated by deviations above 0 and enrichment of the RM allele is indicated by deviations below 0. For the segregating pools, both the control loci involved in MATa selection and the dye used for reference labelling are denoted. In (D), we use a dye-swap experiment to show that the dye used for labelling does not cause any bias in allele frequency measurement. (D) and (E) differ in that (D) shows a MATa pool prior to plating on rich medium and (E) shows a MATa pool after two days of growth on rich medium. In (E), the same pool was hybridized to the genotyping microarray and was sequenced to ~180X coverage with the Illumina Genome Analyzer. The results in (C) and (D) are plots of raw data with no sites removed, while in (E) raw data was plotted with sites more than 1.5 standard deviations away from the local average of the 10 nearest data points removed for clarity.
Figure 2
Figure 2. X-QTL detection of loci for 4-NQO resistance
Results for 4-NQO resistance with RAD5 segregating (top panel) and fixed (bottom panel) are shown. The difference between the average of the selections and the average of the controls generated on the same day is plotted, with enrichment of the BY allele indicated by deviations above 0 and enrichment of the RM allele indicated by deviations below 0. Arrows point to MKT1 and RAD5. The RAD5 fixed population was generated by using a RM parent strain in which the RAD5RM allele was replaced with a RAD5BY::NatMX allele. This strain was constructed by crossing strain EAY1467 to the RM parent strain used for X-QTL.
Figure 3
Figure 3. Genetic architecture of chemical resistance traits
Examples of genetically simple traits (A), examples of genetically complex traits (B), relationship between the number of expected and detected peaks (C), the number of loci detected per trait (D), and a map of compound-specific and pleiotropic loci across the genome (E). In (A) and (B), the −log10(p) values are shown for t-tests comparing selected samples to control samples. The sliding averages within 50 kilobase windows for these tests are plotted. In (C), the global relationship between expected and detected peaks is plotted as a black line and the trait-specific relationships are plotted as grey lines. The red line plots the relationship between expected and detected peaks at an FDR of 0.05. The expected counts were generated from permutations of the chemical resistance dataset. The histogram in (D) was made using loci significant at a global FDR of 0.05. In (E), detected loci were grouped within 20 kb windows across the genome.
Figure 4
Figure 4. X-QTL mapping of mitochondrial activity by cell sorting
Segregants were stained with the dye Mitotracker Red. The comparisons of high and low pools to the entire population are shown, in addition to −log10(p) values for the difference between these groups. The dashed lines in the high or low - control plots indicate zero difference in a comparison, whereas the dashed line in the final plot indicates the probe-level threshold for an FDR of 0.05.

Comment in

Similar articles

Cited by

References

    1. Plomin R, Haworth CM, Davis OS. Common disorders are quantitative traits. Nat Rev Genet. 2009 - PubMed
    1. Manolio TA, et al. Finding the missing heritability of complex diseases. Nature. 2009;461(7265):747–753. - PMC - PubMed
    1. Brem RB, Kruglyak L. The landscape of genetic complexity across 5,700 gene expression traits in yeast. Proc Natl Acad Sci U S A. 2005;102(5):1572–1577. - PMC - PubMed
    1. Hindorff LA, et al. Potential etiologic and functional implications of genome-wide association loci for human diseases and traits. Proc Natl Acad Sci U S A. 2009;106(23):9362–9367. - PMC - PubMed
    1. Visscher PM. Sizing up human height variation. Nat Genet. 2008;40(5):489–490. - PubMed

Publication types

MeSH terms