Pre-dispositions and epigenetic inheritance in the Escherichia coli lactose operon bistable switch
- PMID: 20393577
- PMCID: PMC2872608
- DOI: 10.1038/msb.2010.12
Pre-dispositions and epigenetic inheritance in the Escherichia coli lactose operon bistable switch
Abstract
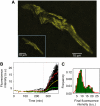
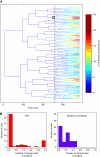
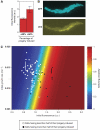
The lactose operon regulation in Escherichia coli is a primary model of phenotypic switching, reminiscent of cell fate determination in higher organisms. Under conditions of bistability, an isogenic cell population partitions into two subpopulations, with the operon's genes turned on or remaining off. It is generally hypothesized that the final state of a cell depends solely on stochastic fluctuations of the network's protein concentrations, particularly on bursts of lactose permease expression. Nevertheless, the mechanisms underlying the cell switching decision are not fully understood. We designed a microfluidic system to follow the formation of a transiently bimodal population within growing microcolonies. The analysis of genealogy and cell history revealed the existence of pre-disposing factors for switching that are epigenetically inherited. Both the pre-induction expression stochasticity of the lactose operon repressor LacI and the cellular growth rate are predictive factors of the cell's response upon induction, with low LacI concentration and slow growth correlating with higher switching probability. Thus, stochasticity at the local level of the network and global physiology are synergistically involved in cell response determination.
Conflict of interest statement
The authors declare that they have no conflict of interest.
Figures


Similar articles
-
Bistability and Nonmonotonic Induction of the lac Operon in the Natural Lactose Uptake System.Biophys J. 2017 May 9;112(9):1984-1996. doi: 10.1016/j.bpj.2017.03.038. Biophys J. 2017. PMID: 28494968 Free PMC article.
-
A stochastic single-molecule event triggers phenotype switching of a bacterial cell.Science. 2008 Oct 17;322(5900):442-6. doi: 10.1126/science.1161427. Science. 2008. PMID: 18927393 Free PMC article.
-
In silico evolved lac operons exhibit bistability for artificial inducers, but not for lactose.Biophys J. 2006 Oct 15;91(8):2833-43. doi: 10.1529/biophysj.105.077420. Epub 2006 Jul 28. Biophys J. 2006. PMID: 16877514 Free PMC article.
-
Bistability, epigenetics, and bet-hedging in bacteria.Annu Rev Microbiol. 2008;62:193-210. doi: 10.1146/annurev.micro.62.081307.163002. Annu Rev Microbiol. 2008. PMID: 18537474 Review.
-
Quantitative approaches to the study of bistability in the lac operon of Escherichia coli.J R Soc Interface. 2008 Aug 6;5 Suppl 1(Suppl 1):S29-39. doi: 10.1098/rsif.2008.0086.focus. J R Soc Interface. 2008. PMID: 18426771 Free PMC article. Review.
Cited by
-
A synthetic growth switch based on controlled expression of RNA polymerase.Mol Syst Biol. 2015 Nov 23;11(11):840. doi: 10.15252/msb.20156382. Mol Syst Biol. 2015. PMID: 26596932 Free PMC article.
-
Measuring single-cell gene expression dynamics in bacteria using fluorescence time-lapse microscopy.Nat Protoc. 2011 Dec 15;7(1):80-8. doi: 10.1038/nprot.2011.432. Nat Protoc. 2011. PMID: 22179594 Free PMC article.
-
Origins of regulated cell-to-cell variability.Nat Rev Mol Cell Biol. 2011 Feb;12(2):119-25. doi: 10.1038/nrm3044. Epub 2011 Jan 12. Nat Rev Mol Cell Biol. 2011. PMID: 21224886 Review.
-
The architecture of a prototypical bacterial signaling circuit enables a single point mutation to confer novel network properties.PLoS Genet. 2013;9(8):e1003706. doi: 10.1371/journal.pgen.1003706. Epub 2013 Aug 22. PLoS Genet. 2013. PMID: 23990799 Free PMC article.
-
Diversification of single-cell growth dynamics under starvation influences subsequent reproduction in a clonal bacterial population.ISME J. 2025 Jan 2;19(1):wrae257. doi: 10.1093/ismejo/wrae257. ISME J. 2025. PMID: 39714219 Free PMC article.
References
-
- Becskei A, Serrano L (2000) Engineering stability in gene networks by autoregulation. Nature 405: 590–593 - PubMed
-
- Bremer H, Dennis PP (1987) Modulation of Chemical Composition and Other Parameters of the Cell by Growth Rate. Escherichia coli and Salmonella Typhimurium: Cellular and Molecular Biology. Washington, DC: American Society for Microbiology. pp 1527–1542
-
- Carrier TA, Keasling JD (1999) Investigating autocatalytic gene expression systems through mechanistic modeling. J Theor Biol 201: 25–36 - PubMed
Publication types
MeSH terms
LinkOut - more resources
Full Text Sources
Miscellaneous

