. 2010 Jun 1;518(11):2109-34.
doi: 10.1002/cne.22334.

Connections of the auditory brainstem in a songbird, Taeniopygia guttata. I. Projections of nucleus angularis and nucleus laminaris to the auditory torus

Affiliations

Connections of the auditory brainstem in a songbird, Taeniopygia guttata. I. Projections of nucleus angularis and nucleus laminaris to the auditory torus

Nils O E Krützfeldt et al. J Comp Neurol. .

Abstract

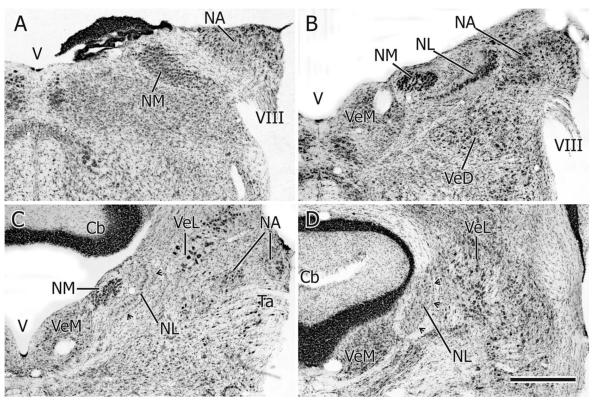
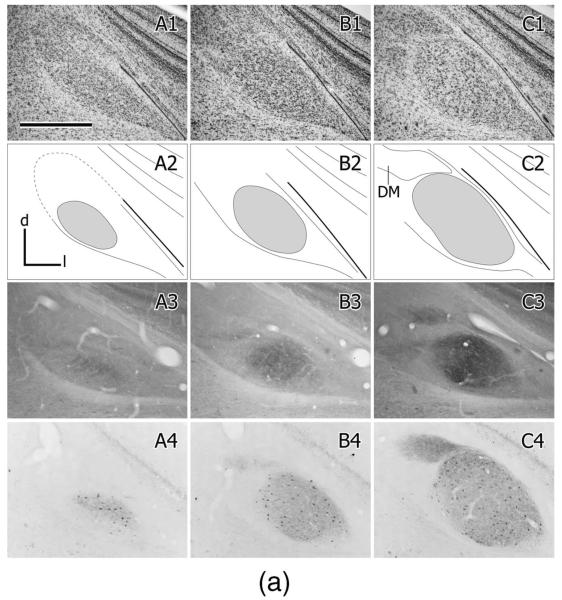
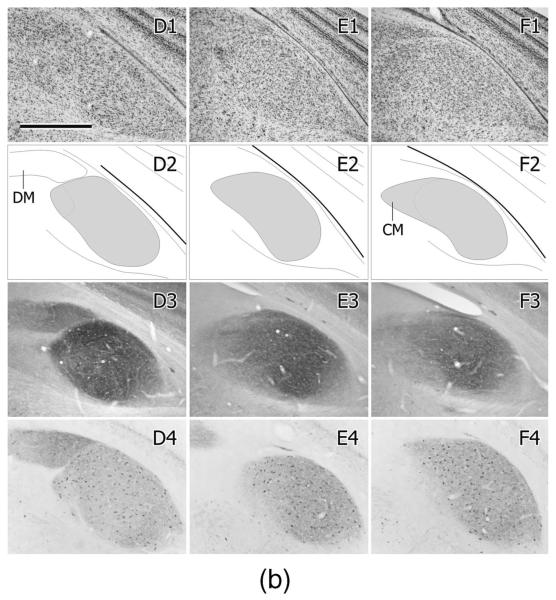
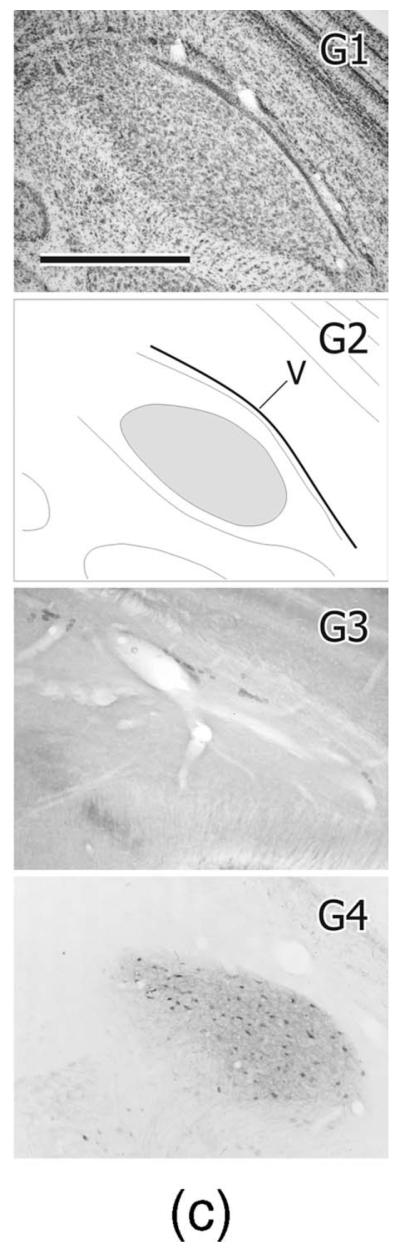
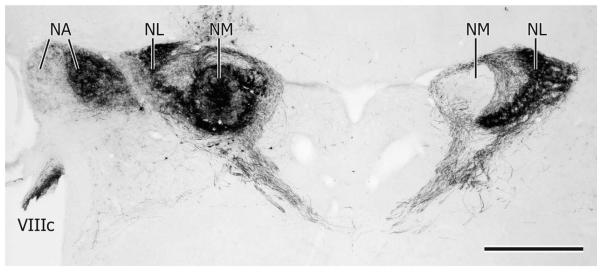
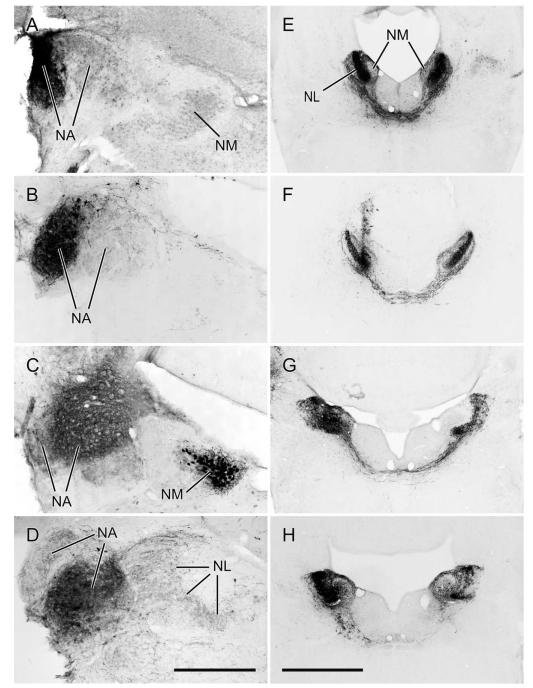
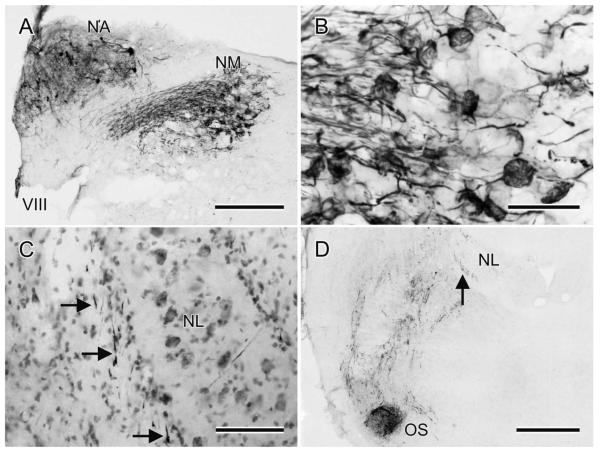
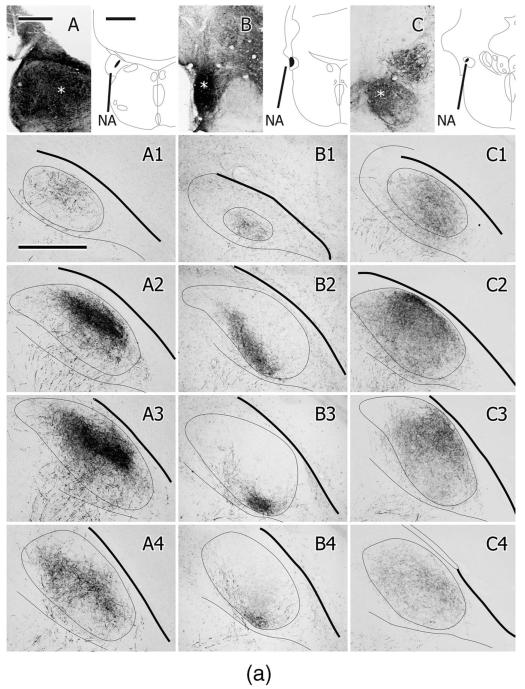
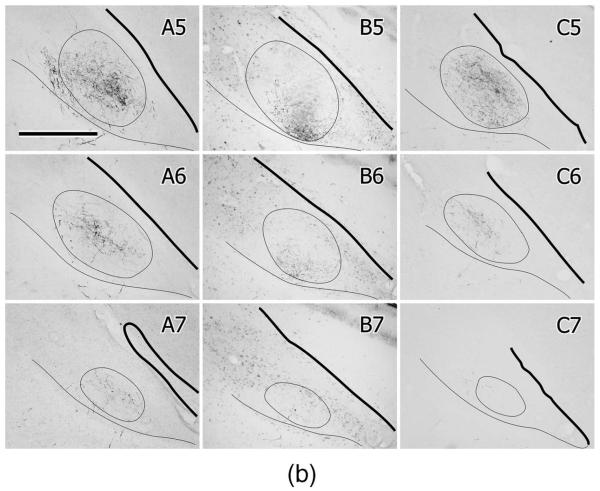
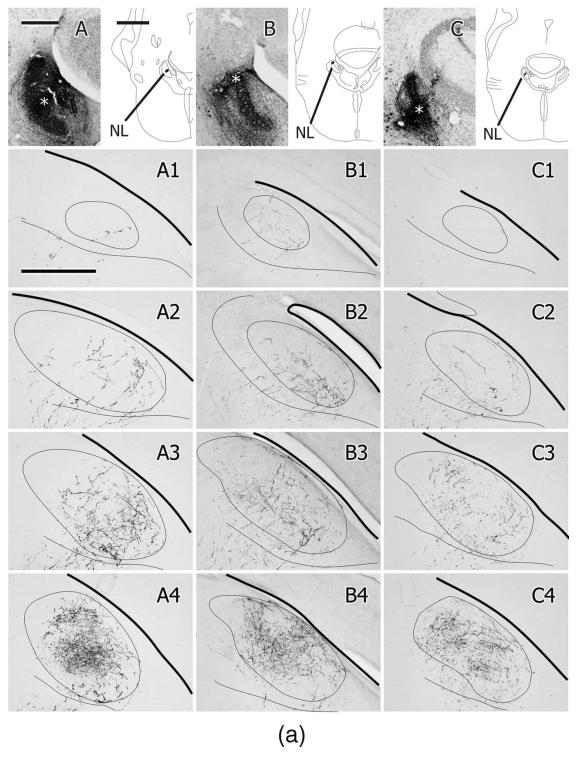
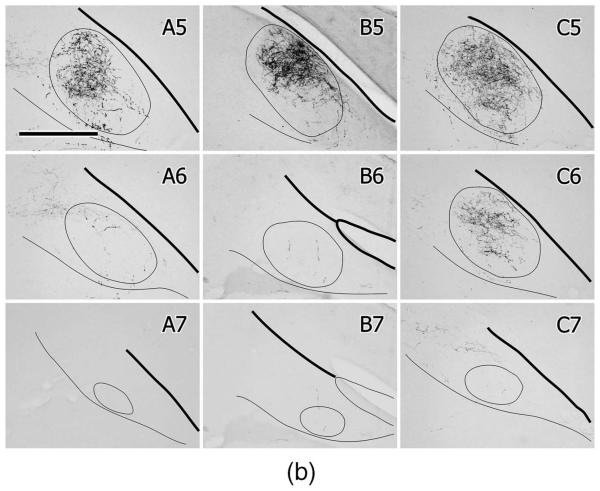
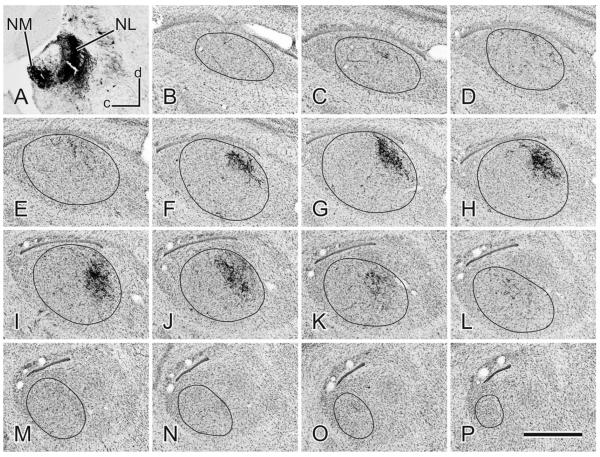
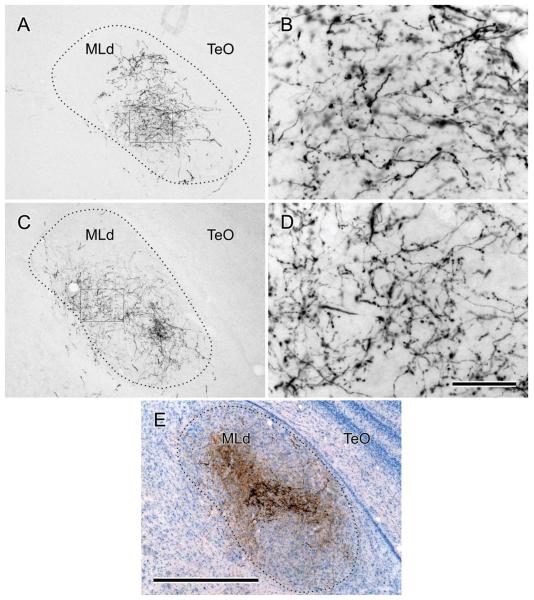
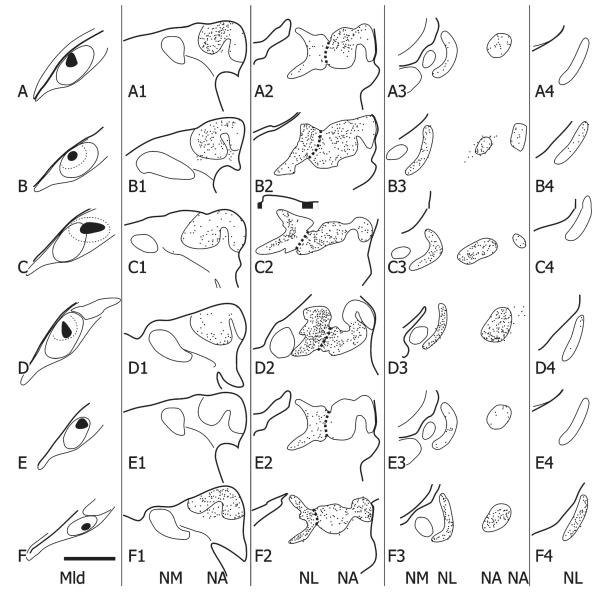
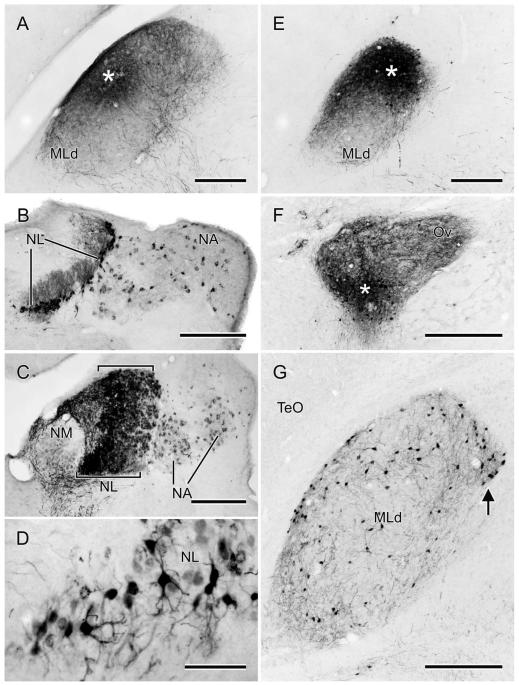
Auditory information is important for social and reproductive behaviors in birds generally, but is crucial for oscine species (songbirds), in particular because in these species auditory feedback ensures the learning and accurate maintenance of song. While there is considerable information on the auditory projections through the forebrain of songbirds, there is no information available for projections through the brainstem. At the latter levels the prevalent model of auditory processing in birds derives from an auditory specialist, the barn owl, which uses time and intensity parameters to compute the location of sounds in space, but whether the auditory brainstem of songbirds is similarly functionally organized is unknown. To examine the songbird auditory brainstem we charted the projections of the cochlear nuclei angularis (NA) and magnocellularis (NM) and the third-order nucleus laminaris (NL) in zebra finches using standard tract-tracing techniques. As in other avian species, the projections of NM were found to be confined to NL, and NL and NA provided the ascending projections. Here we report on differential projections of NA and NL to the torus semicircularis, known in birds as nucleus mesencephalicus lateralis, pars dorsalis (MLd), and in mammals as the central nucleus of the inferior colliculus (ICc). Unlike the case in nonsongbirds, the projections of NA and NL to MLd in the zebra finch showed substantial overlap, in agreement with the projections of the cochlear nuclei to the ICc in mammals. This organization could suggest that the "what" of auditory stimuli is as important as "where."


Figures

Figure 1
Figure 1
A–D: Transverse sections (35 μm thick) at four rostrocaudal levels through the cochlear nuclei (NA, NM) and NL, A being most caudal and D most rostral. Cresyl violet stain. Cb: cerebellum; Ta: tangential nucleus; V: 4th ventricle; VeD: descending vestibular nucleus; VeL: lateral vestibular nucleus; VeM: medial vestibular nucleus; VIII: vestibulocochlear nerve. Arrowheads in C and D point to the wall of glia on the lateral aspect of NL. Scale bar = 500 μm.
Figure 2
Figure 2
A1–G1: A caudal to rostral series of cresyl violet counterstained transverse sections through the right MLd; dorsal is up, lateral to the right. A2–G2: Schematic outlines of the sections shown in A1–G1. MLd is gray; DM is the dorsomedial nucleus of the intercollicular region; CM is the caudomedial nucleus (Puelles et al., 1994; Wild, 1995); V is the tectal ventricle. A3–G3: Cytochrome oxidase stained sections from a different brain at roughly corresponding levels to those in A1–G1. A4–G4: Parvalbumin immunolabeled sections from the same brain shown in A1–G1. Scale bars = 500 μm.
Figure 2
Figure 2
A1–G1: A caudal to rostral series of cresyl violet counterstained transverse sections through the right MLd; dorsal is up, lateral to the right. A2–G2: Schematic outlines of the sections shown in A1–G1. MLd is gray; DM is the dorsomedial nucleus of the intercollicular region; CM is the caudomedial nucleus (Puelles et al., 1994; Wild, 1995); V is the tectal ventricle. A3–G3: Cytochrome oxidase stained sections from a different brain at roughly corresponding levels to those in A1–G1. A4–G4: Parvalbumin immunolabeled sections from the same brain shown in A1–G1. Scale bars = 500 μm.
Figure 3
Figure 3
Noncounterstained transverse section through NA, NM, and NL at a caudal level showing an injection of BDA centered on the left NM. Note 1) retrogradely labeled fibers in the ipsilateral cochlear part of the eighth nerve (VIIIc) and terminal labeling in the medial part of NA; 2) dense anterograde labeling of NM projections to NL bilaterally; 3) the absence of retrogradely labeled cell bodies in the right NM at this level (see text). Scale bar = 500 μm.
Figure 4
Figure 4
A–D: Examples of typical injections in NA. A,B: Injections of BDA confined to the lateral part of NA at a caudal and a slightly more rostral level, respectively. C,D: Injections of CTB in the medial part of NA, C being at approximately the same level as B and D at a similar level to A. C also shows retrogradely labeled cell bodies in NM resulting from an injection of BDA in the contralateral NL in the same case. E–H: Injections of BDA in different parts of the left NL in each case. Note that in each case both the left and the right NL are anterogradely labeled as a result of somatopetal and somatofugal transport to and from NM. Noncounterstained transverse sections. Scale bars = 400 μm for NA cases and 1 mm for NL cases.
Figure 5
Figure 5
A: The results of an injection of BDA in the left NA at a more rostral level. In NA there is diffusion of BDA and some retrogradely labeled cell bodies, the axons of which presumably travel rostrally, through the injection site. Ventromedial to NA there are labeled processes in the eighth nerve root and their calyceal terminations on NM cell bodies, shown at higher power in B. C: BDA-labeled NA axons (at the arrows) adjacent to the lateral border of the ipsilateral NL, Nissl counterstain. D: BDA-labeled processes coursing as several swaths through the tegmentum between an injection in NA at a more caudal level and OS. Most of these processes are NA projections to OS and beyond, but some could be the axons of retrogradely labeled OS neurons. As in C, note the fiber labeling (at the arrow) on the lateral aspect of NL. Scale bars = 250 μm in A; 50 μm in B; 100 μm in C; 500 μm in D.
Figure 6
Figure 6
A–C: Injections of BDA in different parts of the left NA in three different cases, the location of which is shown in the schematic section outlines. The asterisks depict the center of the injection in each case. A1–A7,B1–B7,C1–C7: Caudal to rostral series of projections to the contralateral (right) MLd for each case. Each box depicts the labeled fibers and terminations imaged in three of four consecutive, noncounterstained, 35-μm-thick sections and projected onto an outline of MLd drawn from a middle one of the four. One of the four sections was counterstained but did not contribute to the labeling. The thick line represents the overlying tectal ventricle, the thin line under MLd represents the ventral border of the intercollicular complex. Scale bars = 250 μm for A–C; 1 mm for schematics; 500 μm for A1–C7.
Figure 6
Figure 6
A–C: Injections of BDA in different parts of the left NA in three different cases, the location of which is shown in the schematic section outlines. The asterisks depict the center of the injection in each case. A1–A7,B1–B7,C1–C7: Caudal to rostral series of projections to the contralateral (right) MLd for each case. Each box depicts the labeled fibers and terminations imaged in three of four consecutive, noncounterstained, 35-μm-thick sections and projected onto an outline of MLd drawn from a middle one of the four. One of the four sections was counterstained but did not contribute to the labeling. The thick line represents the overlying tectal ventricle, the thin line under MLd represents the ventral border of the intercollicular complex. Scale bars = 250 μm for A–C; 1 mm for schematics; 500 μm for A1–C7.
Figure 7
Figure 7
A–C: Injections of BDA in different parts of the left NL in three different cases, the location of which is shown in the schematic section outlines. The asterisks depict the center of the injection in each case. A1–A7,B1–B7,C1–C7: Caudal to rostral series of projections to the contralateral (right) MLd for each case. Each box depicts the labeled fibers and terminations imaged in three of four consecutive, noncounterstained, 35-μm-thick sections and projected onto an outline of MLd drawn from a middle one of the four. One of the four sections was counterstained but did not contribute to the labeling. The thick line represents the overlying tectal ventricle, the thin line under MLd represents the ventral border of the intercollicular complex. Scale bars = 250 μm for A–C; 1 mm for schematics; 500 μm for A1–C7.
Figure 7
Figure 7
A–C: Injections of BDA in different parts of the left NL in three different cases, the location of which is shown in the schematic section outlines. The asterisks depict the center of the injection in each case. A1–A7,B1–B7,C1–C7: Caudal to rostral series of projections to the contralateral (right) MLd for each case. Each box depicts the labeled fibers and terminations imaged in three of four consecutive, noncounterstained, 35-μm-thick sections and projected onto an outline of MLd drawn from a middle one of the four. One of the four sections was counterstained but did not contribute to the labeling. The thick line represents the overlying tectal ventricle, the thin line under MLd represents the ventral border of the intercollicular complex. Scale bars = 250 μm for A–C; 1 mm for schematics; 500 μm for A1–C7.
Figure 8
Figure 8
An example of a BDA injection in NL (A) and the projections throughout the contralateral MLd seen in a medial to lateral (B–P) series of sagittal, cresyl violet counterstained sections. Dorsal (d) is up and caudal (c) is left. Scale bar = 500 μm.
Figure 9
Figure 9
A–D: Photomicrographs showing fiber and terminal labeling in the right MLd following injections of BDA in the left NL (A,B) or left NA (C,D). B,D: Higher-power views of the areas boxed in A,C, respectively. E: Photomicrograph of a single, 35-μm, counterstained, transverse section through MLd showing fiber and terminal labeling resulting from a case receiving a BDA injection in NL (black label) and a CTB injection in NA (brown label) on the same side. Scale bars = 500 μm for A,C,E; 50 μm for B,D.
Figure 10
Figure 10
A1–A4,B1–B4F1–F4: Schematic depictions of the location and number of retrogradely labeled cell bodies in single, 35-μm-thick sections through the right NA and NL at four different rostrocaudal levels (the second column being the most caudal and the last column at right the most rostral) resulting from six injections of either CTB (A–D,F) or BDA (E) in the contralateral (left) MLd (one case received two injections, one of CTB (A) and the other of BDA (E)). The injections are shown as solid black in the first column and the labeled cells as dots in the next four columns. The short dashed lines depict the border between NA and NL. Scale bar = 500 μm.
Figure 11
Figure 11
A,E: Photomicrographs of the MLd injections of CTB (A) or BDA (E) (asterisks depict the injection centers) that produced the retrogradely labeled cells in NA and NL depicted in Fig. 10A,E, respectively. B: Retrogradely labeled cells in the right NL and medial and lateral parts of NA, resulting from the injection shown in Fig. 10C. Note the labeling of NL dendrites, particularly on the medial (internal) aspect of the nucleus at this level. C: Retrogradely labeled cell bodies in NL and medial and lateral NA, resulting from the injection of CTB depicted in Fig. 10D. Note the width of NL at this level (between brackets). D: Retrogradely labeled cells in NL resulting from the injection of BDA shown in Figs. 10E and 11E. F: An iontophoretic injection of BDA in the ventral part of the left Ov, asterisk marks its center. G: Retrogradely labeled cells in the ipsilateral MLd resulting from the injection in F. Note the cluster of labeled cells at the ventromedial corner of the nucleus (arrow); see text for normal anatomy of MLd. Scale bars = 250 μm for A–C,E; 75 μm for D; 500 μm for F; 350 μm for G.

Similar articles

Cited by

References

    1. Adolphs R. Acetylcholinesterase staining differentiates functionally distinct auditory pathways in the barn owl. J Comp Neurol. 1993;329:365–377. - PubMed
    1. Alain C, Arnott SR, Hevenor S, Graham S, Grady CL. “What” and “where” in the human auditory system. Proc Natl Acad Sci U S A. 2001;98:12301–12306. - PMC - PubMed
    1. Anderson LA, Malmierca MS, Wallace MN, Palmer AR. Evidence for a direct, short latency projection from the dorsal cochlear nucleus to the auditory thalamus in the guinea pig. Eur J Neurosci. 2006;24:491–498. - PubMed
    1. Anderson LA, Izquierdo MA, Antunes FM. A monosynaptic pathway from dorsal cochlear nucleus to auditory cortex in rat. Neuroreport. 2009;20:462–466. - PubMed
    1. Arends JJ. PhD Thesis. University of Leiden; Leiden, Netherlands: 1981. Sensory and motor aspects of the trigeminal system in the mallard (Anas Platyrhynchos L.)

Publication types

MeSH terms