

Mice with altered serotonin 2C receptor RNA editing display characteristics of Prader-Willi syndrome
- PMID: 20394819
- PMCID: PMC2906772
- DOI: 10.1016/j.nbd.2010.04.004
Mice with altered serotonin 2C receptor RNA editing display characteristics of Prader-Willi syndrome
Abstract
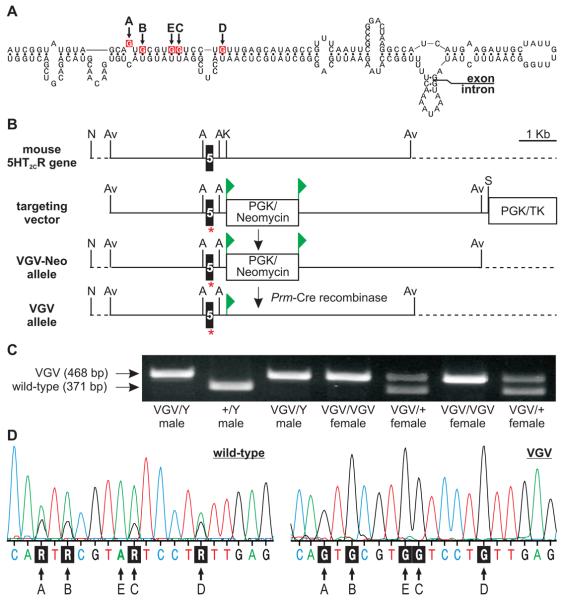
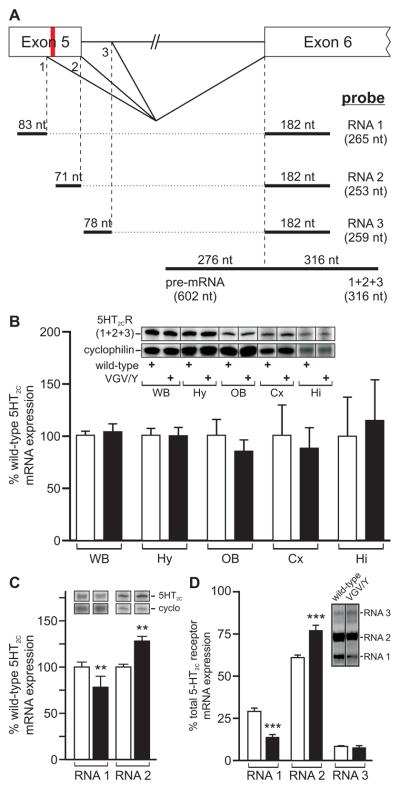
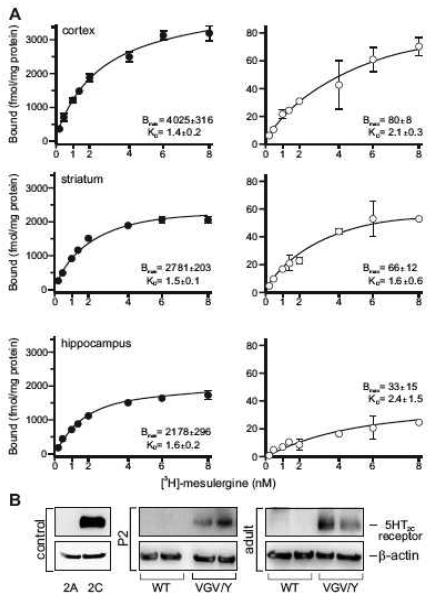
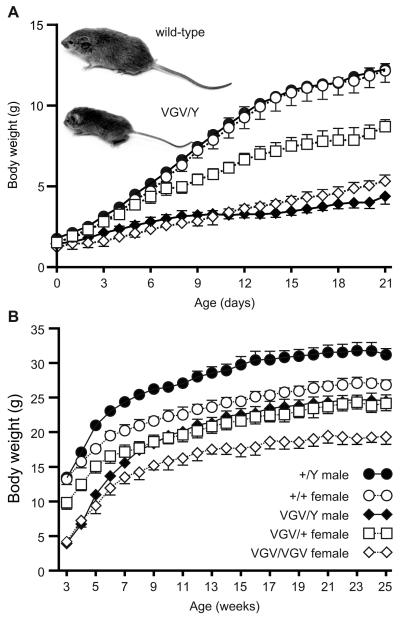
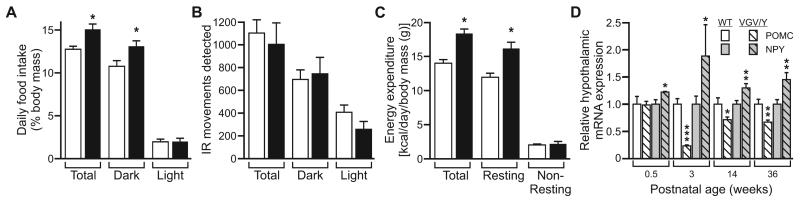
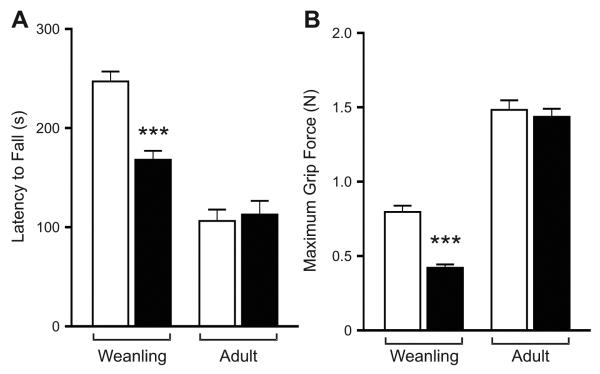
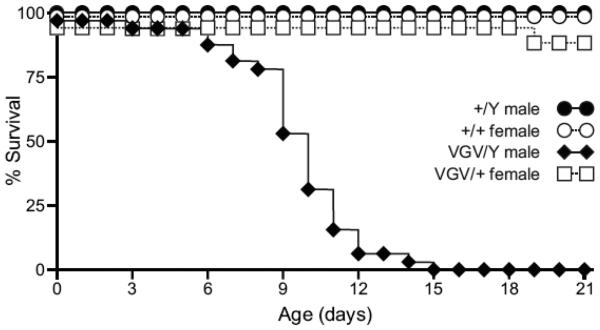
RNA transcripts encoding the 2C-subtype of serotonin (5HT(2C)) receptor undergo up to five adenosine-to-inosine editing events to encode twenty-four protein isoforms. To examine the effects of altered 5HT(2C) editing in vivo, we generated mutant mice solely expressing the fully-edited (VGV) isoform of the receptor. Mutant animals present phenotypic characteristics of Prader-Willi syndrome (PWS) including a failure to thrive, decreased somatic growth, neonatal muscular hypotonia, and reduced food consumption followed by post-weaning hyperphagia. Though previous studies have identified alterations in both 5HT(2C) receptor expression and 5HT(2C)-mediated behaviors in both PWS patients and mouse models of this disorder, to our knowledge the 5HT(2C) gene is the first locus outside the PWS imprinted region in which mutations can phenocopy numerous aspects of this syndrome. These results not only strengthen the link between the molecular etiology of PWS and altered 5HT(2C) expression, but also demonstrate the importance of normal patterns of 5HT(2C) RNA editing in vivo.
Figures
Similar articles
-
Altered ADAR 2 equilibrium and 5HT(2C) R editing in the prefrontal cortex of ADAR 2 transgenic mice.Genes Brain Behav. 2011 Aug;10(6):637-47. doi: 10.1111/j.1601-183X.2011.00701.x. Epub 2011 Jun 13. Genes Brain Behav. 2011. PMID: 21615684 Free PMC article.
-
Dysregulated editing of serotonin 2C receptor mRNAs results in energy dissipation and loss of fat mass.J Neurosci. 2008 Nov 26;28(48):12834-44. doi: 10.1523/JNEUROSCI.3896-08.2008. J Neurosci. 2008. PMID: 19036977 Free PMC article.
-
Loss of the imprinted snoRNA mbii-52 leads to increased 5htr2c pre-RNA editing and altered 5HT2CR-mediated behaviour.Hum Mol Genet. 2009 Jun 15;18(12):2140-8. doi: 10.1093/hmg/ddp137. Epub 2009 Mar 20. Hum Mol Genet. 2009. PMID: 19304781 Free PMC article.
-
Quantitative analysis of 5HT(2C) receptor RNA editing patterns in psychiatric disorders.Neurobiol Dis. 2012 Jan;45(1):8-13. doi: 10.1016/j.nbd.2011.08.026. Epub 2011 Sep 3. Neurobiol Dis. 2012. PMID: 21914481 Free PMC article. Review.
-
Serotonin 2C receptors: suicide, serotonin, and runaway RNA editing.Neuroscientist. 2003 Aug;9(4):237-42. doi: 10.1177/1073858403253669. Neuroscientist. 2003. PMID: 12934707 Review.
Cited by
-
Fragile balance: RNA editing tunes the synapse.Nat Neurosci. 2011 Nov 23;14(12):1492-4. doi: 10.1038/nn.2982. Nat Neurosci. 2011. PMID: 22119945 No abstract available.
-
RNA Structures as Mediators of Neurological Diseases and as Drug Targets.Neuron. 2015 Jul 1;87(1):28-46. doi: 10.1016/j.neuron.2015.06.012. Neuron. 2015. PMID: 26139368 Free PMC article. Review.
-
Serotonergic Control of Metabolic Homeostasis.Front Cell Neurosci. 2017 Sep 20;11:277. doi: 10.3389/fncel.2017.00277. eCollection 2017. Front Cell Neurosci. 2017. PMID: 28979187 Free PMC article. Review.
-
5-HT2 Receptor Regulation of Mitochondrial Genes: Unexpected Pharmacological Effects of Agonists and Antagonists.J Pharmacol Exp Ther. 2016 Apr;357(1):1-9. doi: 10.1124/jpet.115.228395. Epub 2016 Jan 19. J Pharmacol Exp Ther. 2016. PMID: 26787771 Free PMC article.
-
RNA Editing of Serotonin 2C Receptor and Alcohol Intake.Front Neurosci. 2020 Jan 14;13:1390. doi: 10.3389/fnins.2019.01390. eCollection 2019. Front Neurosci. 2020. PMID: 32009879 Free PMC article. Review.
References
-
- Augustine KA, Rossi RM. Rodent mutant models of obesity and their correlations to human obesity. Anat Rec. 1999;257:64–72. - PubMed
-
- Barrett PH, et al. SAAM II: Simulation, Analysis, and Modeling Software for tracer and pharmacokinetic studies. Metabolism. 1998;47:484–92. - PubMed
-
- Bischof JM, et al. Inactivation of the mouse Magel2 gene results in growth abnormalities similar to Prader-Willi syndrome. Hum Mol Genet. 2007;16:2713–9. - PubMed
-
- Burns CM, et al. Regulation of serotonin-2C receptor G-protein coupling by RNA editing. Nature. 1997;387:303–8. - PubMed
Publication types
MeSH terms
Substances
Grants and funding
LinkOut - more resources
Full Text Sources
Other Literature Sources
Medical
Molecular Biology Databases
