

Potential for differentiation of pseudoprogression from true tumor progression with dynamic susceptibility-weighted contrast-enhanced magnetic resonance imaging using ferumoxytol vs. gadoteridol: a pilot study
- PMID: 20395065
- PMCID: PMC3111452
- DOI: 10.1016/j.ijrobp.2009.10.072
Potential for differentiation of pseudoprogression from true tumor progression with dynamic susceptibility-weighted contrast-enhanced magnetic resonance imaging using ferumoxytol vs. gadoteridol: a pilot study
Abstract
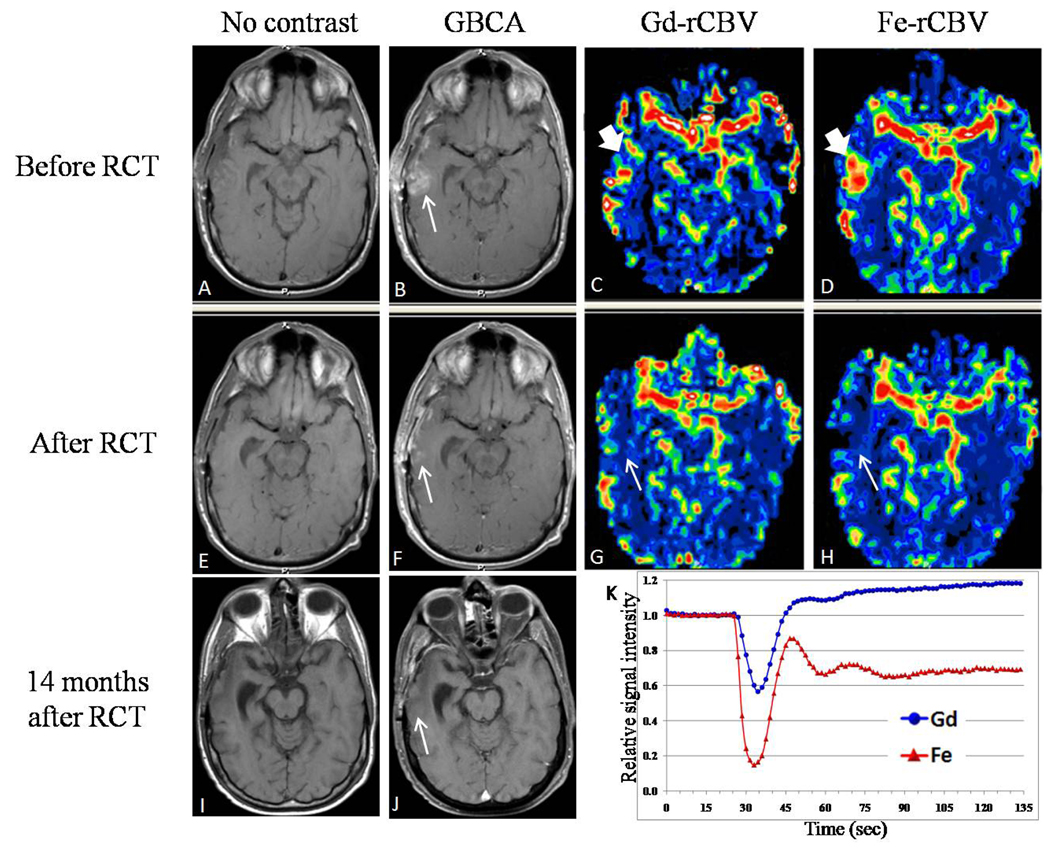
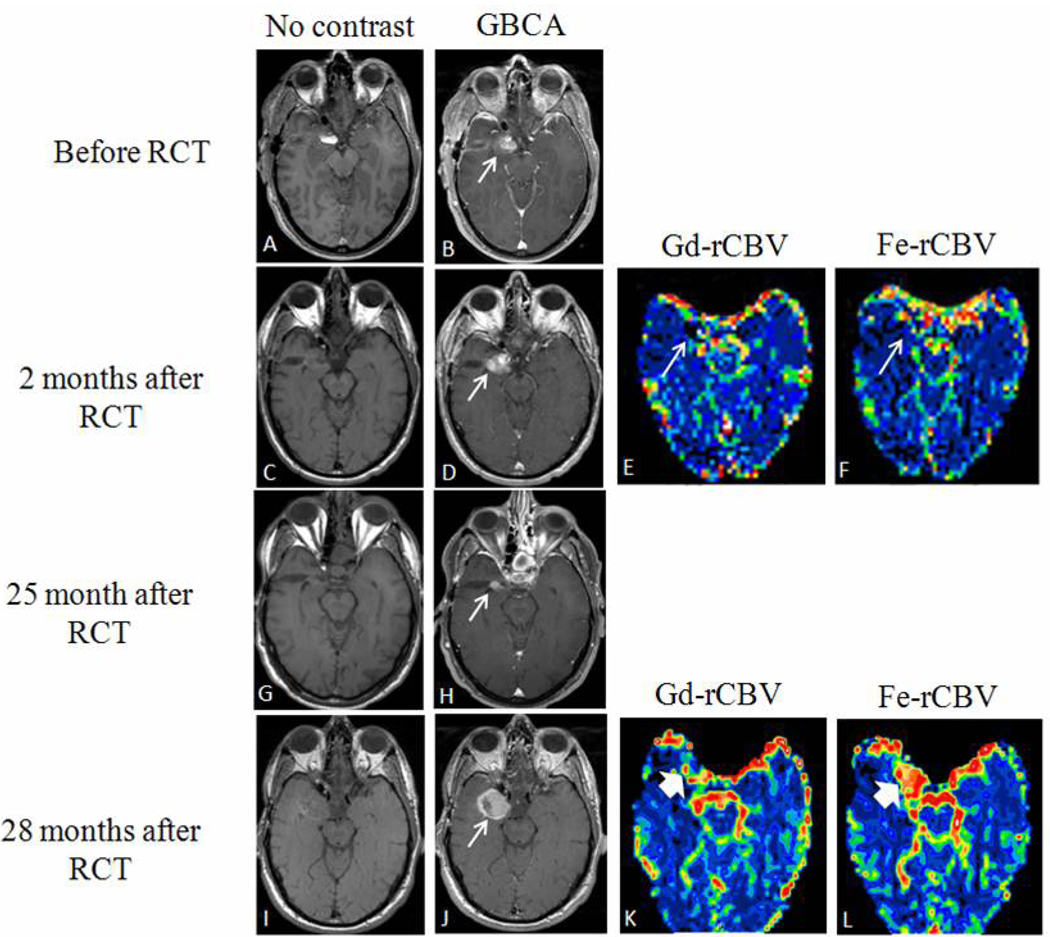
Purpose: We evaluated dynamic susceptibility-weighted contrast-enhanced magnetic resonance imaging (DSC-MRI) using gadoteridol in comparison to the iron oxide nanoparticle blood pool agent, ferumoxytol, in patients with glioblastoma multiforme (GBM) who received standard radiochemotherapy (RCT).
Methods and materials: Fourteen patients with GBM received standard RCT and underwent 19 MRI sessions that included DSC-MRI acquisitions with gadoteridol on Day 1 and ferumoxytol on Day 2. Relative cerebral blood volume (rCBV) values were calculated from DSC data obtained from each contrast agent. T1-weighted acquisition post-gadoteridol administration was used to identify enhancing regions.
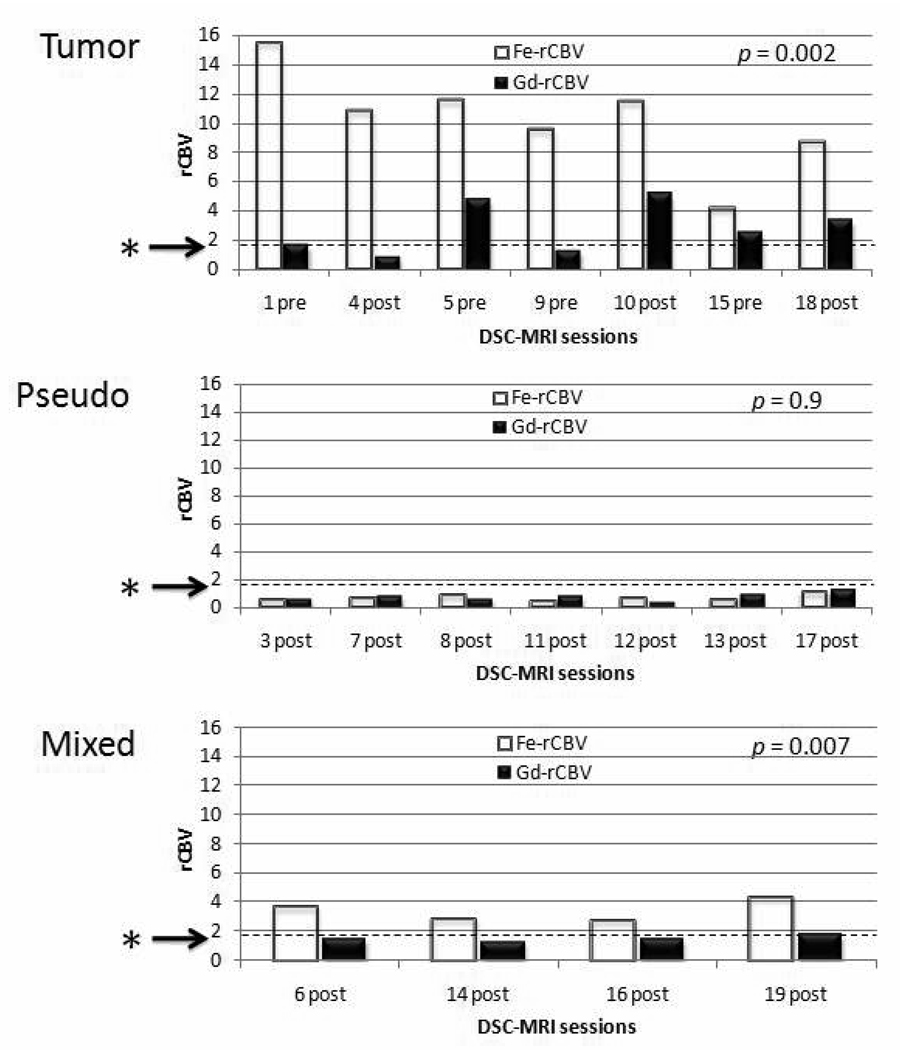
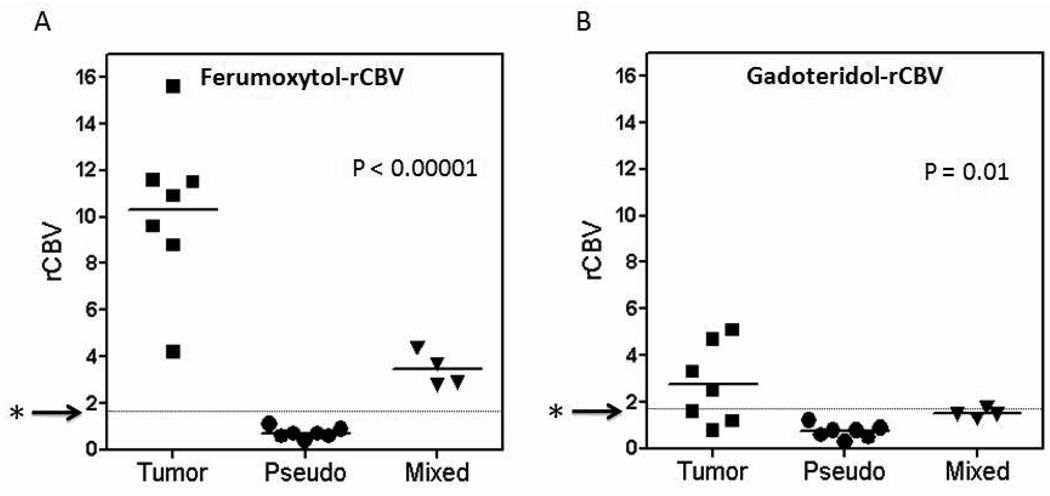
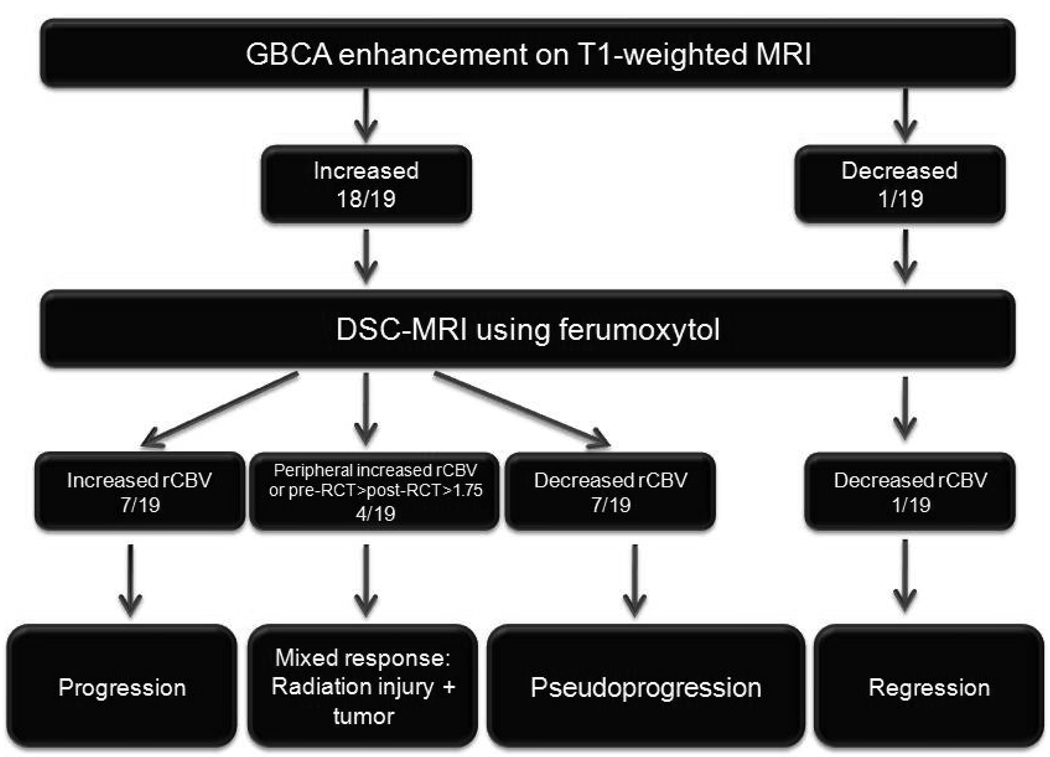
Results: In seven MRI sessions of clinically presumptive active tumor, gadoteridol-DSC showed low rCBV in three and high rCBV in four, whereas ferumoxytol-DSC showed high rCBV in all seven sessions (p = 0.002). After RCT, seven MRI sessions showed increased gadoteridol contrast enhancement on T1-weighted scans coupled with low rCBV without significant differences between contrast agents (p = 0.9). Based on post-gadoteridol T1-weighted scans, DSC-MRI, and clinical presentation, four patterns of response to RCT were observed: regression, pseudoprogression, true progression, and mixed response.
Conclusion: We conclude that DSC-MRI with a blood pool agent such as ferumoxytol may provide a better monitor of tumor rCBV than DSC-MRI with gadoteridol. Lesions demonstrating increased enhancement on T1-weighted MRI coupled with low ferumoxytol rCBV are likely exhibiting pseudoprogression, whereas high rCBV with ferumoxytol is a better marker than gadoteridol for determining active tumor. These interesting pilot observations suggest that ferumoxytol may differentiate tumor progression from pseudoprogression and warrant further investigation.
Copyright © 2011 Elsevier Inc. All rights reserved.
Conflict of interest statement
The authors have no conflict of interest. There is a sponsored research agreement to OHSU from AMAG Pharmaceuticals.
Figures

Similar articles
-
Pseudoprogression of glioblastoma after chemo- and radiation therapy: diagnosis by using dynamic susceptibility-weighted contrast-enhanced perfusion MR imaging with ferumoxytol versus gadoteridol and correlation with survival.Radiology. 2013 Mar;266(3):842-52. doi: 10.1148/radiol.12111472. Epub 2012 Nov 30. Radiology. 2013. PMID: 23204544 Free PMC article. Clinical Trial.
-
Magnetic resonance imaging of intracranial tumors: intra-patient comparison of gadoteridol and ferumoxytol.Neuro Oncol. 2011 Feb;13(2):251-60. doi: 10.1093/neuonc/noq172. Epub 2010 Dec 16. Neuro Oncol. 2011. PMID: 21163809 Free PMC article.
-
Dual contrast perfusion MRI in a single imaging session for assessment of pediatric brain tumors.J Neurooncol. 2012 Aug;109(1):105-14. doi: 10.1007/s11060-012-0872-x. Epub 2012 Apr 19. J Neurooncol. 2012. PMID: 22528798 Free PMC article.
-
Cerebral blood volume mapping with ferumoxytol in dynamic susceptibility contrast perfusion MRI: Comparison to standard of care.J Magn Reson Imaging. 2018 Aug;48(2):441-448. doi: 10.1002/jmri.25943. Epub 2018 Jan 4. J Magn Reson Imaging. 2018. PMID: 29314418 Free PMC article.
-
Current and potential imaging applications of ferumoxytol for magnetic resonance imaging.Kidney Int. 2017 Jul;92(1):47-66. doi: 10.1016/j.kint.2016.12.037. Epub 2017 Apr 20. Kidney Int. 2017. PMID: 28434822 Free PMC article. Review.
Cited by
-
High-resolution, whole-body vascular imaging with ferumoxytol as an alternative to gadolinium agents in a pediatric chronic kidney disease cohort.Pediatr Nephrol. 2015 Mar;30(3):515-21. doi: 10.1007/s00467-014-2953-x. Epub 2014 Sep 12. Pediatr Nephrol. 2015. PMID: 25212105 Free PMC article.
-
Ferumoxytol enhanced resting state fMRI and relative cerebral blood volume mapping in normal human brain.Neuroimage. 2013 Dec;83:200-9. doi: 10.1016/j.neuroimage.2013.06.066. Epub 2013 Jul 3. Neuroimage. 2013. PMID: 23831413 Free PMC article.
-
Using iron oxide nanoparticles to diagnose CNS inflammatory diseases and PCNSL.Neurology. 2013 Jul 16;81(3):256-63. doi: 10.1212/WNL.0b013e31829bfd8f. Epub 2013 Jun 14. Neurology. 2013. PMID: 23771486 Free PMC article.
-
Case-Based Review: newly diagnosed glioblastoma.Neurooncol Pract. 2015 Sep;2(3):106-121. doi: 10.1093/nop/npv020. Epub 2015 Jul 21. Neurooncol Pract. 2015. PMID: 31386093 Free PMC article.
-
Clinical Imaging for Diagnostic Challenges in the Management of Gliomas: A Review.J Neuroimaging. 2020 Mar;30(2):139-145. doi: 10.1111/jon.12687. Epub 2020 Jan 10. J Neuroimaging. 2020. PMID: 31925884 Free PMC article. Review.
References
-
- Brandsma D, Stalpers L, Taal W, et al. Clinical features, mechanisms, and management of pseudoprogression in malignant gliomas. Lancet Oncol. 2008;9:453–461. - PubMed
-
- Chaskis C, Neyns B, Michotte A, et al. Pseudoprogression after radiotherapy with concurrent temozolomide for high-grade glioma: clinical observations and working recommendations. Surg Neurol. 2009 - PubMed
-
- Chamberlain MC, Glantz MJ, Chalmers L, et al. Early necrosis following concurrent Temodar and radiotherapy in patients with glioblastoma. J Neurooncol. 2007;82:81–83. - PubMed
-
- Tofilon PJ, Fike JR. The radioresponse of the central nervous system: a dynamic process. Radiat Res. 2000;153:357–370. - PubMed
-
- Wong CS, Van der Kogel AJ. Mechanisms of radiation injury to the central nervous system: implications for neuroprotection. Mol Interv. 2004;4:273–284. - PubMed
Publication types
MeSH terms
Substances
Grants and funding
LinkOut - more resources
Full Text Sources
Other Literature Sources
Medical
