Review
. 2010 May 1;51 Suppl 1(Suppl 1):107S-121S.
doi: 10.2967/jnumed.109.068221. Epub 2010 Apr 15.

Multimodality imaging of myocardial injury and remodeling

Affiliations
Review

Multimodality imaging of myocardial injury and remodeling

Christopher M Kramer et al. J Nucl Med. .

Abstract

Advances in cardiovascular molecular imaging have come at a rapid pace over the last several years. Multiple approaches have been taken to better understand the structural, molecular, and cellular events that underlie the progression from myocardial injury to myocardial infarction (MI) and, ultimately, to congestive heart failure. Multimodality molecular imaging including SPECT, PET, cardiac MRI, and optical approaches is offering new insights into the pathophysiology of MI and left ventricular remodeling in small-animal models. Targets that are being probed include, among others, angiotensin receptors, matrix metalloproteinases, integrins, apoptosis, macrophages, and sympathetic innervation. It is only a matter of time before these advances are applied in the clinical setting to improve post-MI prognostication and identify appropriate therapies in patients to prevent the onset of congestive heart failure.
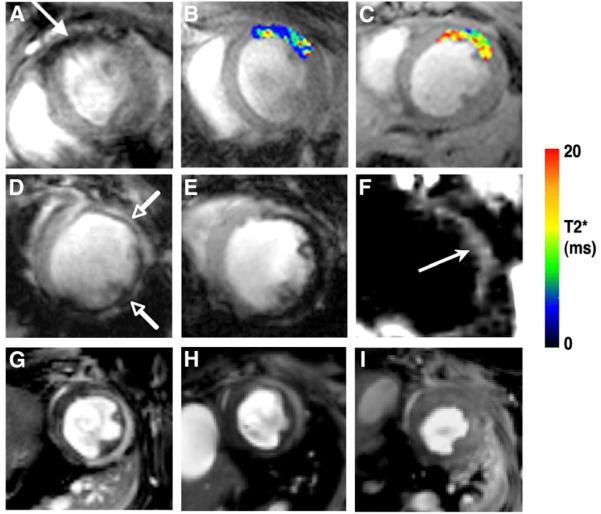

Figures

FIGURE 1
FIGURE 1
Imaging of MMP activity after infarction. Hybrid micro-SPECT/CT–reconstructed short-axis images were acquired without radiographic contrast (A) in control sham-operated mouse (left) and selected mice at 1 wk (middle) and 3 wk (right) after MI, after injection of 201Tl (top row, green) and 99mTc-RP805 (middle row, red). Black-and-white and multicolor fusion image is shown on bottom. Control heart demonstrates normal myocardial perfusion and no focal 99mTc-RP805 uptake within heart, although some uptake is seen in chest wall at thoracotomy site (dashed arrows). All post-MI mice have large anterolateral 201Tl perfusion defect (yellow arrows) and focal uptake of 99mTc-RP805 in defect area. Dashed circle is drawn around heart to demonstrate localization of 99mTc-RP805, MMP radiotracer, within infarcted area of heart. Some activity is also seen in periinfarct border zone. Additional micro-SPECT/CT images were acquired using higher-resolution SPECT detector after administration of radiographic contrast, at 1 (B) and 3 wk (C) after MI. Contrast agent permitted better definition of LV myocardium, which is highlighted by white dotted line. Representative short-axis (SA), horizontal long-axis (HLA), and vertical long-axis (VLA) images are shown. Focal uptake of 99mTc-RP805 is seen within central infarct and periinfarct regions, which again correspond to 201Tl perfusion defect. Ant = anterior; Inf = inferior; Lat = lateral; Sep = septal. (Reprinted with permission of (9).)
FIGURE 2
FIGURE 2
Quantification of hybrid dual-isotope 99mTc-RP805 and 201Tl SPECT/CT images. (A) Registered dual 201Tl/99mTc-RP805 SPECT/CT–based attenuation-corrected images in a dog 2 wk after MI are shown in standard format. Images were quantified using circumferential quantitative approach previously described. Activity (percentage injected dose [%ID]) quantified from dual 201Tl/99mTc-RP805 SPECT with attenuation correction using global minimum normal limit was compared with activity (%ID) derived from postmortem γ-well-counting. (B) Quantitative profiles and summary of quantitative data for same dog as in A. LA = long axis. (Adapted with permission of (12).)
FIGURE 3
FIGURE 3
Noninvasive imaging of angiotensin receptors with radiolabeled losartan. Micro-SPECT and micro-CT images are shown in control mouse after 99mTc-losartan administration; no uptake in heart can be seen in in vivo and ex vivo images (A). There is only some liver uptake, on bottom left of SPECT image. (B) In 3-wk post-MI animal, significant radiolabeled losartan uptake is observed in anterolateral wall (arrows). Infarct uptake on in vivo image is confirmed in ex vivo image. Histogram (C) demonstrates significantly (*) higher uptake in infarcted region (0.524 ± 0.212 percentage injected dose per gram [%ID/g]), as compared with control noninfarcted animals (0.215 ± 0.129 %ID/g; P < 0.05). (Reprinted with permission of (17).)
FIGURE 4
FIGURE 4
DSI tractography of excised rat heart showing transmural variation in myocardial microstructure (25). Fiber tracts are color-coded by helix or spiral angle they make with long axis of left ventricle. Left ventricle is being viewed from its lateral wall (A and C–F) and in its short axis (B). Only those fibers intersecting spheric region of interest are displayed in D–F. Subendocardial fibers have positive or right-handed helix angle, and in lateral wall, they course toward anteroapex. However, those in subepicardium have negative or left-handed helix angle, and in lateral wall, they course from anterobase toward posteroapex. Fibers in mid myocardium have a zero helix angle and are thus circumferential. Endo = endocardium; Mid = mid myocardium; Epi = epicardium. (Reproduced with permission of (23).)
FIGURE 5
FIGURE 5
Molecular and cellular MRI of myocardium in vivo in mice with ischemic myocardial injury. (A–C) In vivo MRI of cardiomyocyte apoptosis in mouse model of ischemic reperfusion (40). (A) Uptake of AnxCLIO–Cy5.5 in injured myocardium produces negative contrast in anterior wall. (B and C) T2* maps created in hypokinetic areas of myocardium. T2* was significantly shorter in mice injected with active probe (B) than in mice injected with unlabeled control probe (C). (Reproduced with permission of (40).) (D and E) In vivo MRI of myocardial macrophage accumulation in mice 96 h after MI. (Reproduced with permission of (39).) Mouse in D was injected intravenously with 3 mg of CLIO–Cy5.5 per kilogram and mouse in E with 20 mg of CLIO–Cy5.5 per kilogram. Linear response in tissue contrast between uninjured septum and injured anterolateral wall (arrows) is seen (39). (F) Off-resonance imaging of postinfarction myocardial macrophage infiltration (38). Positive contrast is produced in vicinity of iron-oxide uptake (arrow) but also in other areas of susceptibility shifts such as air–tissue interfaces. (Reproduced with permission of (38).) (G–I) In vivo MRI of myocardial myeloperoxidase activity in healing myocardial infarcts. (Reproduced with permission of (42).) (G) Wild-type mouse injected with myeloperoxidase-activatable agent shows increased signal intensity in injured anterolateral wall on T1-weighted image. Significantly less signal enhancement is seen in heterozygous myeloperoxidase knockout mouse (H) and virtually none in homozygous knockout mouse (I) (42).
FIGURE 6
FIGURE 6
FMT of myocardial macrophage infiltration in vivo (39). Reconstructed coronal slices from 3-dimensional FMT dataset have been superimposed on white-light images of mice. Slices 2–4 in FMT dataset intersected heart, whereas slices 5–8 passed posterior to it. (A) Long-axis MRI in infarcted mouse corresponding to slice 2 from fluorescence dataset of that mouse, which passed through heart (B). (C) Slice 5 from fluorescence dataset of infarcted mouse, which passed posterior to heart. Corresponding slices (D, slice 2; E, slice 5) of sham-operated mouse are shown. (F) Depth-resolved fluorescence intensity in heart was significantly greater (*P < 0.05) in infarcted mice than in sham-operated mice. AU = arbitrary units. (Reproduced with permission of (39).)
FIGURE 7
FIGURE 7
OPT of mouse heart ex vivo (49). (A) Chemical treatment of heart reduces scattering, allowing tomographic reconstruction to be produced purely from absorption maps of tissue. (B) Short-axis reconstruction of mouse heart produced by inverse radon transform of absorption data. (C) Volume-rendered OPT reconstruction of mouse heart showing structures such as trabeculations in fine detail. (Reproduced with permission of (49).)
FIGURE 8
FIGURE 8
Three-dimensional finite element model derived from 3-dimensional myocardial tagging cardiac MRI study of LV remodeling in mice after reperfused MI. Each panel depicts end systole, at baseline and at days 1, 7, and 28 after MI (from left to right). Septum is on left. Lines denote model element boundaries. Crosses denote 3-dimensional principal strains and directions. (Adapted with permission of (53).)
FIGURE 9
FIGURE 9
End-diastolic–to–end-systolic radial strain maps from mouse heart 1 d after reperfused MI using displacement-encoding-with-stimulated-echoes cardiac MRI (A) and speckle-tracking analysis of ultrasound images (B). End-diastolic–to–end-systolic circumferential strain maps from same mouse heart using cardiac MRI (C) and ultrasound (D). In both short-axis radial and circumferential maps, defects in contraction are observed in anterolateral LV (as indicated by arrows). (Adapted with permission of (64)).
FIGURE 10
FIGURE 10
Myocardial perfusion assessed with 2-dimensional short-axis myocardial contrast echocardiography (MCE) in ischemic mouse hearts. Color-coding scheme for MCE images was selected to facilitate comparison with color photographs of triphenyltetrazolium chloride– and phthalo-blue–stained tissue sections from excised mouse hearts: normally perfused regions are in blue, ischemic regions in white to pink, and intermediately perfused regions in red. Good agreement was observed between regions identified as ischemic by MCE and those identified as ischemic or necrotic by histologic staining of postmortem tissue. (Adapted with permission of (65).)
FIGURE 11
FIGURE 11
SPECT of myocardial perfusion (using 99mTc-methoxyisobutylisonitrile) and innervation (using 99mTc-MIBG) in a patient 2 wk after anteroapical MI. SPECT images and polar maps show small perfusion defect in apex and distal anteroseptal wall, along with innervation defect that exceeds perfusion defect significantly in anterior, septal, and inferior regions. Perfusion defect size (right) was calculated as 14% of polar map and innervation defect as 33%, resulting in perfusion/innervation mismatch covering 19% of LV myocardium in infarct border zone. SA = short axis; HLA = horizontal long axis; VLA = vertical long axis.

References

    1. Sutton MG, Sharpe N. Left ventricular remodeling after myocardial infarction. Pathophysiology and therapy. Circulation. 2000;101:2981–2988. - PubMed
    1. Weber KT. Extracellular matrix remodeling in heart failure: a role for de novo angiotensin II generation. Circulation. 1997;96:4065–4082. - PubMed
    1. Spinale FG. Myocardial matrix remodeling and the matrix metalloproteinases: influence on cardiac form and function. Physiol Rev. 2007;87:1285–1342. - PubMed
    1. Creemers EE, Davis JN, Parkhurst AM, et al. Deficiency of TIMP-1 exacerbates LV remodeling after myocardial infarction in mice. Am J Physiol Heart Circ Physiol. 2003;284:H364–H371. - PubMed
    1. Mukherjee R, Mingoia JT, Bruce JA, et al. Selective spatiotemporal induction of matrix metalloproteinase-2 and matrix metalloproteinase-9 transcription following myocardial infarction. Am J Physiol Heart Circ Physiol. 2006;291:2216–2228. - PubMed

Publication types

MeSH terms

Substances