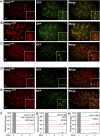
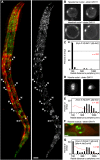
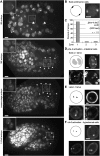
. 2010 Apr 15;24(8):766-82.
doi: 10.1101/gad.559610.

The spatial dynamics of tissue-specific promoters during C. elegans development

Affiliations

The spatial dynamics of tissue-specific promoters during C. elegans development

Peter Meister et al. Genes Dev. .

Abstract

To understand whether the spatial organization of the genome reflects the cell's differentiated state, we examined whether genes assume specific subnuclear positions during Caenorhabditis elegans development. Monitoring the radial position of developmentally controlled promoters in embryos and larval tissues, we found that small integrated arrays bearing three different tissue-specific promoters have no preferential position in nuclei of undifferentiated embryos. However, in differentiated cells, they shifted stably toward the nuclear lumen when activated, or to the nuclear envelope when silent. In contrast, large integrated arrays bearing the same promoters became heterochromatic and nuclear envelope-bound in embryos. Tissue-specific activation of promoters in these large arrays in larvae overrode the perinuclear anchorage. For transgenes that carry both active and inactive promoters, the inward shift of the active promoter was dominant. Finally, induction of master regulator HLH-1 prematurely induced internalization of a muscle-specific promoter array in embryos. Fluorescence in situ hybridization confirmed analogous results for the endogenous endoderm-determining gene pha-4. We propose that, in differentiated cells, subnuclear organization arises from the selective positioning of active and inactive developmentally regulated promoters. We characterize two forces that lead to tissue-specific subnuclear organization of the worm genome: large repeat-induced heterochromatin, which associates with the nuclear envelope like repressed genes in differentiated cells, and tissue-specific promoters that shift inward in a dominant fashion over silent promoters, when they are activated.


Figures
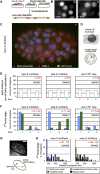
Figure 1.
Figure 1.
Developmentally regulated promoters are positioned randomly in undifferentiated embryonic nuclei and relocate upon differentiation depending on expression status. (A) Outline of the plasmids used to create small bombarded transgenes. mCherry is driven by developmentally regulated promoters. An array of 256 lacO sites was cobombarded with the unc-119+ marker. (B) GFP signal in embryonic cells from a strain expressing GFP-LacI without (−lacO; strain GW395) or with bombarded transgenes containing lacO arrays (+lacO; strain GW397); see A. Bar, 2 μm. (C) Partial 3D reconstitution of a 120-cell-stage embryo (strain GW397) carrying a lacO-tagged transgene gwIs28[myo-3∷mCherry; 256xlacO; unc-119+] and expressing GFP-LacI. The embryo is stained for GFP (anti-GFP, green), the nuclear lamina (anti-LMN-1, red), and DNA (Hoechst, blue). Bar, 1 μm. (D) Quantification of radial positioning of GFP-LacI-tagged transgenes. Through-focus stacks of images are acquired at 200-nm intervals. In the plane where the GFP-LacI focus is brightest, the nuclear cross-section is divided in three concentric zones of equal surface area. The ratio of the distance from the spot to the periphery (black line) and the nuclear radius (red line/2) is determined for each spot. Random localization would lead to 33% in each zone. (E) Quantification of small transgene position in early-stage embryos before mCherry is detectable using the method described in D. The strains used are myo-3∷mCherry (strain GW397), pha-4∷mCherry (strain GW429), and unc-119+ only (strain GW401). n = number of foci counted. χ2 versus random: P = 0.1 (GW397), P = 0.9 (GW429), and P = 0.66 (GW401). (F) As E, except for nuclei in L1 larvae of the indicated cell types (intestinal cells: green bars; hypodermal and seam cells: blue bars), all of which have spherical nuclei. The strains used are myo-3∷mCherry (strain GW455), pha-4∷mCherry (strain GW431), and unc-119+ only (strain GW447). These three strains carry the same small transgenes as GW397, GW429, and GW401 scored in E, respectively, but also express a GFP-LMN-1 fusion from another transgene to identify the nuclear periphery. Cells were identified by their position and/or mCherry expression; hypoderm and seam cell results were combined. χ2 versus random: P < 10−4 in all tissues and all strains. χ2 between intestinal and hypodermal distributions: P < 2 × 10⁻¹⁶). (G) To quantify position in ellipsoid nuclei, the shortest radial distance between the GFP-LacI focus and the NE identified by GFP-LMN-1 is measured in the plane of focus. Bar, 2 μm. (H) Quantification of the small transgene array (myo-3∷mCherry) in L1 larvae muscle (black bars), hypoderm and seam cells (combined, blue bars), and intestinal cells (green bars) in strain GW455, using the method described in G. Muscle cells are identified by mCherry expression. Random distribution of distances obtained from a simulation using similar nuclear shapes is shown as a red dotted line (Kolgomorov-Smirnov vs. random: P < 0.002; between muscle and hypoderm: P < 10−11; between muscle and intestine: P < 10−9).
Figure 2.
Figure 2.
Integrated plasmids in the worm genome can be detected by GFP-LacI. (A) Outline of the plasmids used to create the integrated [baf-1∷gfp-lacI; myo-3∷rfp] array. The baf-1 promoter drives GFP-LacI expression in all cells. The cytoplasmic RFP marker under the control of the myo-3 promoter is specifically active in muscle cells. (B) Quantification by qPCR of copy number for plasmids present in the arrays shown in Figures 1C and 2C. Numbers are normalized to the endogenous single-copy gene (lmn-1). AmpR = bla. (C) GFP signal in an embryo homozygous for an integrated [baf-1∷gfp-lacI; myo-3∷rfp] array (strain GW76). In each nucleus, two spots can be observed. Bar, 2 μm. (D) GFP signal in two nuclei from an embryo heterozygous for the [baf-1∷gfp-lacI; myo-3∷rfp] array (F1 from strain GW76 crossed to wild-type N2). Bar, 2 μm. (E) GFP signal in one nucleus from an embryo homozygous for two arrays: the [baf-1∷gfp-lacI; myo-3∷rfp] array and an unrelated array, pxIs6[pha-4∷gfp∷h2b] (strain GW81). Bar, 2 μm. (F) GFP signal in a nucleus from a strain GW318 carrying both a large array (gwIs4[baf-1∷gfp-lacI; myo-3∷rfp]) and a small transgene (gwIs28[myo-3∷mCherry; 256xlacO; unc-119+]). Arrowheads indicate small transgenic arrays. Bar, 2 μm.
Figure 3.
Figure 3.
Large arrays carrying silent chromatin modifications are at the nuclear periphery. (A) Immunostaining of H3K9me3 and GFP, and their colocalization in embryos of the strain GW76 carrying the [baf-1∷gfp-lacI; myo-3∷rfp] array. A projection of multiple planes of a deconvolved Deltavision wide-field image is shown. Bar, 3 μm. (B) As A, for H3K27me3 and GFP, with colocalization in GW76 embryos. Bar, 3 μm. (C) As A, for H3K4me3 and GFP in GW76 embryos. Bar, 3 μm. (D) As A, for H3K9me3 and GFP, in embryos of GW318, which bears both a large array that expresses GFP-LacI ([baf-1∷gfp-lacI; myo-3∷rfp]) and a small bombarded transgene expressing mCherry under transcriptional control of the myo-3 promoter. The large arrays, but not the brighter small transgenes, colocalize with H3K9me3 staining. Bar, 3 μm. (E) As D, for H3K27me3 and GFP, in embryos of GW318. Bar, 3 μm. (F) Quantification of the subnuclear position in embryonic nuclei of the [baf-1∷gfp-lacI; myo-3∷rfp] array from strain GW76 using the three-zone method (Fig. 1D). (G) As F, for an unrelated pxIs6[pha-4∷gfp∷h2b] array in early embryos of strain SM469. (H) As F, for localization of highly active constitutively expressed promoter [sur-5∷gfp] in a large integrated array (strain GW427) in embryos probed by FISH.
Figure 4.
Figure 4.
Relocation of differentiation-induced arrays to the nuclear interior. (A) An L1-stage larva of strain GW111 carrying the [baf-1∷gfp-lacI; myo-3∷rfp] array and expressing GFP-LMN-1 to highlight the nuclear periphery. The four lines of muscle nuclei can be observed due to RFP expression (labeled M), while internal intestine nuclei are labeled I. Bar, 10 μm. (B) GFP signal in two examples of hypodermal nuclei (top) and intestinal nuclei (bottom) from the L1 larva of strain GW111 shown in A. Bar, 2 μm. (C) Quantification of the radial distance (in nanometers) of the [baf-1∷gfp-lacI; myo-3∷rfp] array to the periphery in nonmuscle cells in strain GW111, as in Figure 1G. (D) GFP signal in two examples of muscle nuclei from the L1 larva of strain GW111 shown in A. Bar, 2 μm. (E) Quantification of the radial distance (in nanometers) of the [baf-1∷gfp-lacI; myo-3∷rfp] array to the periphery in muscle cells in strain GW111, calculated on the focal plane as described in Figure 1G. Random distribution in similarly shaped nuclei is shown as a red dotted line. Kolgomorov-Smirnov versus random distributions: P < 10−15. (F) GFP and RFP signal in a muscle nucleus from an L1 larva of strain GW171 carrying both an active array ([baf-1∷gfp-lacI; myo-3∷rfp]) and an inactive array {caIs[pha-4∷lacZ rol-6(su1006)]}. Bar, 2 μm. (G) Quantification of the radial distance (in nanometers) of active array [baf-1∷gfp-lacI; myo-3∷rfp] and inactive array caIs[pha-4∷lacZ rol-6(su1006)] in muscle cells of the strain GW171, as described in Figure 1G. Random distribution in similarly shaped nuclei is shown as a red dotted line. Kolgomorov-Smirnov versus random distributions: P < 0.001.
Figure 5.
Figure 5.
Differentiation-induced relocation of large arrays is accompanied by decondensation and is observed in multiple tissues. (A) GFP signal in embryos during early development from strain GW583 carrying the caIs[pha-4∷lacZ rol-6(su1006)] array. (Arrowheads) Intestinal precursor cells (E lineage). Bar, 2 μm. (B) GFP signal in early embryonic cells from strain GW583. Bar, 2 μm. (C) Quantification of the subnuclear position of the caIs[pha-4∷lacZ rol-6(su1006)] array using the three-zone method (Fig. 1D) in embryonic nuclei from strain GW583. (D) GFP signal in intestine cell nuclei from GW583 early L1 larvae. The arrays, active in intestinal cells, are seen detached from the nuclear lamina (arrows). Bar, 2 μm. Autofluorescence from the gut is marked as stars. (E) GFP signal in intestine cell nuclei from late L1 larvae of strain GW583. Bar, 2 μm. Autofluorescence from the gut is marked as stars. (F) GFP signal in hypodermal cell nuclei from L1 larvae of strain GW583. Bar, 2 μm.
Figure 6.
Figure 6.
Ectopic expression of HLH-1 induces decondensation and relocation of myo-3 promoter arrays A and B. GFP signal in an embryo of strain GW110 containing two independent arrays: gwIs4[baf-1∷gfp-lacI;myo-3∷rfp] and cgc3595Is[hsp-16.2∷pha-4;rol-6(su1006)]. The embryo is shown before (A) and immediately after (B) 10 min of HS at 34°C. The boxed nucleus is shown as a time course after HS on the right side. Similar features are observed before and immediately after HS for strain GW105, containing arrays gwIs4[baf-1∷gfp-lacI;myo-3∷rfp] and gvIs[hsp-16.2∷hlh-1;rol-6(su1006)]. Bar, 2 μm. (C) Terminal differentiation state after ectopic induction of pharyngeal fate in strain GW110 (see above). Bar, 2 μm. (D) As C, after ectopic induction of muscle fate in GW105 (see above). Bar, 2 μm. (E) Scoring of nuclear localization and shape of arrays upon HS-induced pharyngeal differentiation in strain GW110. The key is shown to the right. (F) As E, after HS-induced muscle differentiation in strain GW105. The key is shown to the right. Note that the localization of the myo-3 array in the center is heritable through mitosis.
Figure 7.
Figure 7.
Localization of endogenous genes by FISH relative to the NE. (A) Heat maps of the transcription of the genomic regions encompassing 60 kb around the baf-1, tbb-1, and pha-4 genes, respectively. (Green) High RNA levels; (red) no or very little RNA, based on Baugh et al. (2005). (B) Partial 3D projection of an immunofluorescence/FISH experiment in strain SM469 expressing gfp-h2b under transcriptional control of the pha-4 promoter from an array (pxIs6[pha-4∷gfp∷h2b]) with a probe recognizing the genomic pha-4 locus. (Green) Anti-GFP; (red) pha-4 FISH; (blue) DAPI. Bar, 1 μm. (C) Quantification of FISH signal position for the baf-1 and tbb-1 active housekeeping gene regions in 20- to 50-cell-stage wild-type embryos. Nuclear localization was scored as described in Figure 1D. (D) Quantification of FISH signal position for the pha-4 locus for early embryos (left panel, χ2 test vs. random: P < 10−16) and in later embryos (right panel) with active pha-4 promoter (pha-4, active), as judged by the presence of the GFP-H2B signal, or with silent pha-4 (pha-4, inactive, no GFP signal). GFP-H2B is under control of the full-length pha-4 promoter in an array in strain SM469. χ2 versus random: P = 0.6 (active pha-4), P < 10−16 (inactive pha-4). (E) Partial 3D projection of a FISH experiment in intestinal cells and head nuclei (to scale) in wild-type N2 adult worms with a probe recognizing the genomic pha-4 locus. Several spots are observed in intestinal cells, as this tissue is polyploid. (Red) pha-4 FISH; (blue) Hoechst. Bar, 1 μm. (F) Quantification of FISH signal in intestinal nuclei (white bars) and head nuclei excluding those inside the pharynx (gray bars) of wild-type adult worms, using the method described in Figure 1G. Kolgomorov-Smirnov between head and intestinal distributions: P < 10−16. (G) Same data as in F, quantified using the zoning method described in Figure 1D. χ2 versus random: P < 10−16 (head nuclei), P < 0.07 (intestine nuclei).
Figure 8.
Figure 8.
Model summarizing gene positioning during differentiation Two major forces drive tissue-specific subnuclear organization of the worm genome: repeat-induced heterochromatin, which associates with the NE, and tissue-specific promoters that shift inward in a dominant fashion when they are activated. Tissue-specific promoters shift in a nondominant manner to the NE in cells in which they are inactive.

Similar articles

Cited by

References

    1. Akhtar A, Gasser SM 2007. The nuclear envelope and transcriptional control. Nat Rev Genet 8: 507–517 - PubMed
    1. Andersen EC, Horvitz HR 2007. Two C. elegans histone methyltransferases repress lin-3 EGF transcription to inhibit vulval development. Development 134: 2991–2999 - PubMed
    1. Azzaria M, Goszczynski B, Chung MA, Kalb JM, McGhee JD 1996. A fork head/HNF-3 homolog expressed in the pharynx and intestine of the Caenorhabditis elegans embryo. Dev Biol 178: 289–303 - PubMed
    1. Baugh LR, Hill AA, Claggett JM, Hill-Harfe K, Wen JC, Slonim DK, Brown EL, Hunter CP 2005. The homeodomain protein PAL-1 specifies a lineage-specific regulatory network in the C. elegans embryo. Development 132: 1843–1854 - PubMed
    1. Belmont AS 2001. Visualizing chromosome dynamics with GFP. Trends Cell Biol 11: 250–257 - PubMed

Publication types

MeSH terms