. 2010 Apr 15;24(8):837-52.
doi: 10.1101/gad.1897010.

Chronic cisplatin treatment promotes enhanced damage repair and tumor progression in a mouse model of lung cancer

Affiliations

Chronic cisplatin treatment promotes enhanced damage repair and tumor progression in a mouse model of lung cancer

Trudy G Oliver et al. Genes Dev. .

Abstract

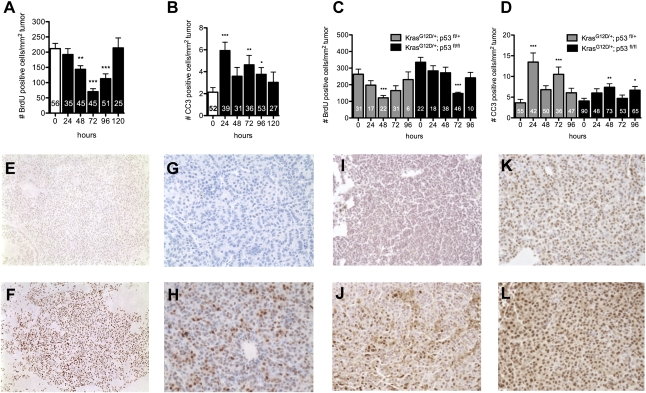
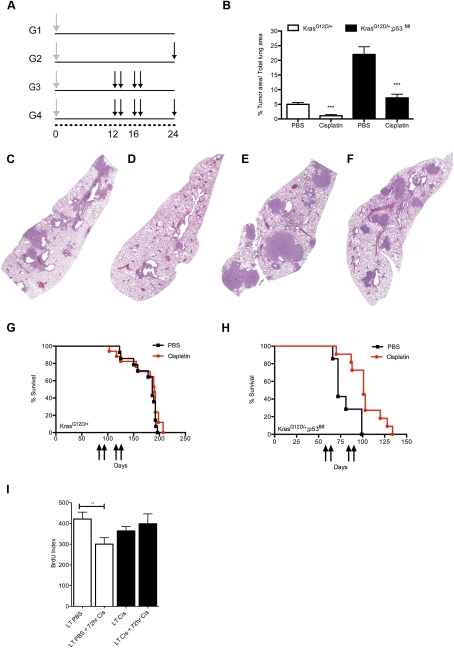
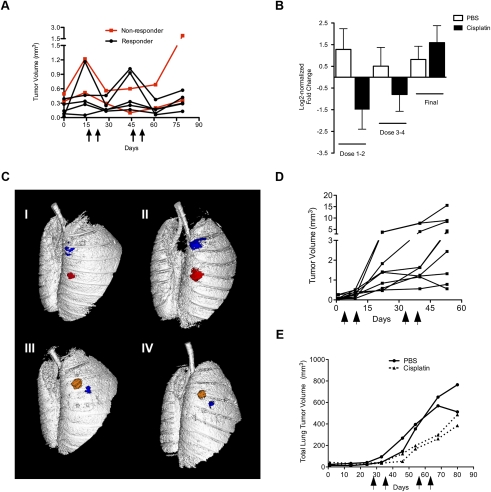
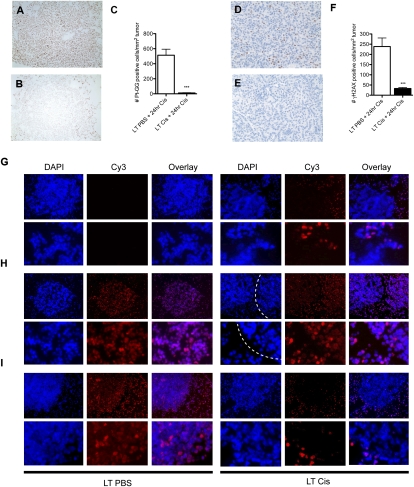
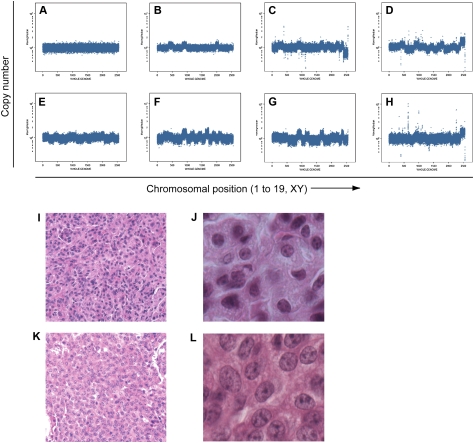
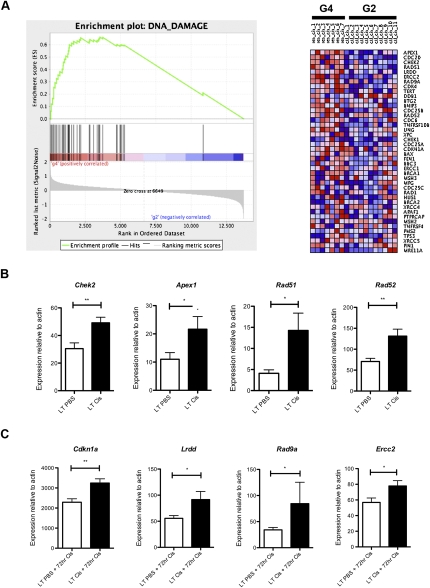
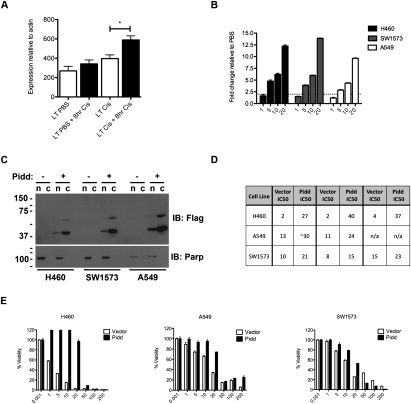
Chemotherapy resistance is a major obstacle in cancer treatment, yet the mechanisms of response to specific therapies have been largely unexplored in vivo. Employing genetic, genomic, and imaging approaches, we examined the dynamics of response to a mainstay chemotherapeutic, cisplatin, in multiple mouse models of human non-small-cell lung cancer (NSCLC). We show that lung tumors initially respond to cisplatin by sensing DNA damage, undergoing cell cycle arrest, and inducing apoptosis-leading to a significant reduction in tumor burden. Importantly, we demonstrate that this response does not depend on the tumor suppressor p53 or its transcriptional target, p21. Prolonged cisplatin treatment promotes the emergence of resistant tumors with enhanced repair capacity that are cross-resistant to platinum analogs, exhibit advanced histopathology, and possess an increased frequency of genomic alterations. Cisplatin-resistant tumors express elevated levels of multiple DNA damage repair and cell cycle arrest-related genes, including p53-inducible protein with a death domain (Pidd). We demonstrate a novel role for PIDD as a regulator of chemotherapy response in human lung tumor cells.


Figures

Figure 1.
Figure 1.
Cisplatin induces cell cycle arrest and cell death in KrasG12D-initiated lung tumors, independently of p53 activity. (A) Number of BrdU-positive cells per lung tumor area from LSL-KrasG12D/+ mice treated with a single dose (7 mg/kg body weight) of cisplatin and analyzed 0–120 h later. (B) Number of CC3-positive cells per lung tumor area, as in A. (C) Number of BrdU-positive cells per lung tumor area from LSL-KrasG12D/+ mice either heterozygous or homozygous for the p53fl/fl allele, treated as in A. (D) Number of CC3-positive cells per lung tumor area from LSL-KrasG12D/+ mice either heterozygous or homozygous for the p53flfl allele, treated as in A. In A–D, number of tumors analyzed is shown for each bar. Error bars represent standard error of the mean (SEM). Significant changes compared with control are indicated by (*) P < 0.04, (**) P < 0.006, or (***) P < 0.0001. (E–L) PBS-treated lung tumors (E,G,I,K) or cisplatin-treated lung tumors (F,H,J,L) stained with Pt-1,2-d(GpG) antibody (8 h) (E,F), γ-H2AX antibody (24 h) (G,H), anti-phospho Chk1 (Ser345) antibody (12 h) (I,J), or anti-phospho Chk2 (Thr68) antibody (12 h) (K,L).
Figure 2.
Figure 2.
Cisplatin treatment significantly reduces lung tumor burden in KrasG12D-initiated lung tumors regardless of p53 activity. (A) Treatment regimens for groups 1–4 (G1–G4). Mice were infected with AdCre to permit expression of KrasG12D at time 0 (gray arrow). Cisplatin was given at indicated time points in weeks (black arrows) for each group. (B) Tumor area/total lung area in control (G1) versus treated (G3) LSL-KrasG12D/+ mice (white bars; [***] P < 0.002) and in LSL-KrasG12D/+;p53fl/fl mice (black bars; [***] P < 0.0001). (C–F). Representative H&E stains at 2× magnification of PBS-treated (C,E) or cisplatin-treated (D,F) lungs from LSL-KrasG12D/+ mice (C,D) or LSL-KrasG12D/+;p53fl/fl mice (E,F). (G,H). Kaplan-Meier survival curves of LSL-KrasG12D/+ mice (G) and LSL-KrasG12D/+;p53fl/fl mice (H) treated with four doses of cisplatin (red) or PBS (black). Black arrows indicate cisplatin treatments at X number of days post-AdCre infection. For H, cisplatin significantly prolongs survival (P < 0.002). (I) Number of BrdU-positive cells per lung tumor area in LSL-KrasG12D/+ mice with or without a final 72-h dose of cisplatin ([**] P < 0.009). Error bars represent SEM.
Figure 3.
Figure 3.
In vivo microCT imaging reveals lung tumor regression and stasis in response to cisplatin in LSL-KrasG12D/+ mice, and decelerated growth in LSL-KrasG12D/+;p53fl/fl mice. (A) Tumor volume dynamics of individual cisplatin-treated tumors in LSL-KrasG12D/+ mice. Black arrows on the X-axis indicate cisplatin treatments. Red lines indicate tumors that stopped responding to treatment after three to four doses. The X-axis indicates days following the first pretreatment microCT scan, which occurred 14 wk post-AdCre infection. (B) Log2-normalized fold change in tumor volume of individual tumors in PBS-treated (white bars) and cisplatin-treated (black bars) mice. Tumor volumes were quantified before and after doses 1 and 2 (Dose 1–2), before and after doses 3 and 4 (Dose 3–4), and before and after one final dose (Final). (C) Representative microCT lung reconstructions before and after two doses of PBS (panels I,II) or cisplatin (panels III,IV) with individual lung tumors pseudocolored. (D) Tumor volume dynamics of individual cisplatin-treated tumors in response to cisplatin in LSL-KrasG12D/+;p53fl/fl mice. Black arrows on the X-axis indicate cisplatin treatments. (E) Total lung tumor volume in LSL-KrasG12D/+;p53fl/fl mice (n = 2 mice per group) treated with four doses of PBS (solid lines with circles) or cisplatin (dashed lines). Arrows on the X-axis (days following AdCre infection) indicate one dose of PBS or cisplatin.
Figure 4.
Figure 4.
Long-term cisplatin-treated lung tumors in LSL-KrasG12D/+ mice exhibit enhanced adduct repair in response to a final dose of cisplatin. (A) Representative sensitive lung tumor section (G2) stained with Pt-1,2-d(GpG) from long-term PBS-treated mice given a final 24-h dose of cisplatin. (B) Representative resistant tumor section (G4) from long-term cisplatin-treated mice, treated as in A. (C) Number of Pt-1,2-d(GpG)-positive cells per lung tumor area in long-term PBS-treated (white bar) or cisplatin-treated (black bar) mice given a final dose of cisplatin and sacrificed 24 h later ([***] P < 0.0001). (D) Representative sensitive tumor section (G2) stained with γ-H2AX from long-term PBS-treated mice given a final 24-h dose of cisplatin. (E) Representative resistant tumor (G4) from long-term cisplatin-treated mice, treated as in D. (F) Number of γ-H2AX-positive cells per lung tumor area in long-term PBS-treated (white bar) or cisplatin-treated (black bar) mice given a final dose of cisplatin and sacrificed 24 h later ([***] P < 0.0001). Error bars represent SEM. (G–I). Representative immunofluorescent images of lung tumor sections stained for nuclei (DAPI) or Pt-1,2-d(GpG) (Cy3), and an overlay of these images (Overlay) in mice treated with long-term PBS (LT PBS) or four doses of cisplatin (LT Cis) and given a final dose of cisplatin and analyzed after 0 h (G), 4 h (H), or 24 h (I). The top panels are 10× magnification, and the bottom panels are higher-magnification zooms. (G) Note that adducts persist in normal parts of the lung even after multiple weeks in long-term cisplatin (LT Cis, 0 h). In H (LT Cis, 4 h, DAPI), two tumors are separated by a dotted white line. Approximately 20% of tumors in long-term cisplatin mice had reduced adduct levels as early as 4 h after a final dose of cisplatin (left tumor) whereas the majority of tumors had similar levels of adducts (right tumor) at this time point.
Figure 5.
Figure 5.
DNA copy number profiling by ROMA reveals cisplatin treatment enhances the percentage of lung tumors from LSL-KrasG12D/+ mice with whole-chromosomal gains and losses. (A) Representative genomic profile of lung tumors from PBS-treated mice. Nine of 11 PBS-treated tumors did not exhibit genomic changes. (B–H) Representative genomic profiles of cisplatin-treated tumors with significant whole-chromosomal DNA copy number changes. Nineteen of 23 cisplatin-treated tumors harbored whole-chromosomal changes. The X-axis indicates chromosomal position from chromosome 1 to 19, and XY chromosomes. The Y-axis indicates copy number. (I,J) Representative H&E-stained tumor section from PBS-treated mice with low-grade tumor histology (20×, I), and a higher-magnification panel from the same tumor (40×, J). (K,L) Representative H&E-stained tumor section from cisplatin-treated mice with high-grade tumor histology (20×, K), and a higher-magnification panel from the same tumor (40×, L). Note the larger nuclei, more diffuse nuclear staining, and higher nuclear to cytoplasmic ratio in K and L compared with I and J.
Figure 6.
Figure 6.
Genes associated with DNA damage and repair are up-regulated in cisplatin-resistant lung tumors in vivo. (A) Enrichment plot of the DNA damage gene set identified by GSEA and corresponding heat map for G2 versus G4. Expression level is represented as a gradient from high (red) to low (blue). (B) Expression of indicated genes in long-term PBS (LT PBS) versus long-term cisplatin-treated (four doses, LT Cis) tumors. (C) Expression of indicated genes in long-term PBS (LT PBS) or long-term cisplatin (LT Cis) tumors treated with a final 72-h dose of cisplatin (LT PBS + 72 h Cis or LT Cis + 72 h Cis). All genes were analyzed in triplicate by real-time RT–PCR on six independent tumors per treatment group. Expression levels are normalized to β-actin. (**) P < 0.009; (*) P < 0.05. Error bars represent SEM.
Figure 7.
Figure 7.
Overexpression of PIDD confers resistance to cisplatin in human NSCLC cell lines. (A) Expression levels of Pidd mRNA in LSL-KrasG12D/+ lung tumors treated with PBS or four total doses of cisplatin, with or without a final 8-h dose of cisplatin (n = 6 tumors per group). P < 0.01. Error bars represent SEM. (B) Expression levels of PIDD mRNA in human NSCLC lines treated with increasing doses of cisplatin (micromolar) and harvested 24 h following treatment. The Y-axis is fold change relative to PBS-treated cells. Expression levels are normalized to ACTIN. (C) PIDD overexpression in human NSCLC lines by Western blot (IB) for Flag, and for Parp to confirm purity of nuclear/cytoplasmic fractions. Upon longer exposure, full-length PIDD is apparent in the cytoplasm, and both PIDD cleavage products are also present in the nucleus (data not shown). (D) IC50 values for cisplatin treatment in each cell line with MSCV Vector or MSCV-PIDD expression from three independent experiments performed in triplicate. (E) Representative survival plots for indicated cell lines expressing MSCV Vector or MSCV-Pidd treated with 0–200 μM cisplatin (X-axis) and analyzed 48 h later using CellTiter-Glo cell viability assay. The Y-axis represents percent of viable cells normalized to PBS-treated control. Error bars represent standard deviation.

Similar articles

Cited by

References

    1. Ahrendt SA, Chow JT, Yang SC, Wu L, Zhang MJ, Jen J, Sidransky D 2000. Alcohol consumption and cigarette smoking increase the frequency of p53 mutations in non-small cell lung cancer. Cancer Res 60: 3155–3159 - PubMed
    1. American Cancer Society 2007. American Cancer Society Cancer Facts and Figures 2007. American Cancer Society, Atlanta, GA
    1. Bando T, Fujimura M, Kasahara K, Matsuda T 1998. Significance of Na+, K+-ATPase on intracellular accumulation of cis-diamminedichloroplatinum(II) in human non-small-cell but not in small-cell lung cancer cell lines. Anticancer Res 18: 1085–1089 - PubMed
    1. Bartz SR, Zhang Z, Burchard J, Imakura M, Martin M, Palmieri A, Needham R, Guo J, Gordon M, Chung N, et al. 2006. Small interfering RNA screens reveal enhanced cisplatin cytotoxicity in tumor cells having both BRCA network and TP53 disruptions. Mol Cell Biol 26: 9377–9386 - PMC - PubMed
    1. Blommaert FA, van Dijk-Knijnenburg HC, Dijt FJ, den Engelse L, Baan RA, Berends F, Fichtinger-Schepman AM 1995. Formation of DNA adducts by the anticancer drug carboplatin: Different nucleotide sequence preferences in vitro and in cells. Biochemistry 34: 8474–8480 - PubMed

Publication types

MeSH terms