. 2010 Jul;21(7):1115-24.
doi: 10.1681/ASN.2009070760. Epub 2010 Apr 15.

PKC-delta promotes renal tubular cell apoptosis associated with proteinuria

Affiliations

PKC-delta promotes renal tubular cell apoptosis associated with proteinuria

Xiaoning Li et al. J Am Soc Nephrol. 2010 Jul.

Abstract

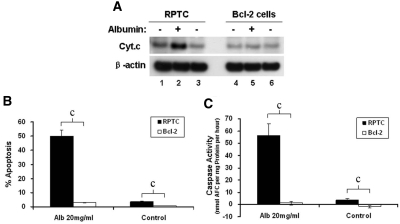
Proteinuria may contribute to progressive renal damage by inducing tubulointerstitial inflammation, fibrosis, and tubular cell injury and death, but the mechanisms underlying these pathologic changes remain largely unknown. Here, in a rat kidney proximal tubular cell line (RPTC), albumin induced apoptosis in a time- and dose-dependent manner. Caspase activation accompanied albumin-induced apoptosis, and general caspase inhibitors could suppress this activation. In addition, Bcl-2 transfection inhibited apoptosis and attenuated albumin-induced Bax translocation to mitochondria and cytochrome c release from the organelles, further confirming a role for the intrinsic pathway of apoptosis in albuminuria-associated tubular apoptosis. We observed phosphorylation and activation of PKC-delta early during treatment of RPTC cells with albumin. Rottlerin, a pharmacologic inhibitor of PKC-delta, suppressed albumin-induced Bax translocation, cytochrome c release, and apoptosis. Moreover, a dominant-negative mutant of PKC-delta blocked albumin-induced apoptosis in RPTC cells. In vivo, we observed activated PKC-delta in proteinuric kidneys of streptozotocin-induced diabetic mice and in kidneys after direct albumin overload. Notably, albumin overload induced apoptosis in renal tubules, which was less severe in PKC-delta-knockout mice. Taken together, these results suggest that activation of PKC-delta promotes tubular cell injury and death during albuminuria, broadening our understanding of the pathogenesis of progressive proteinuric kidney diseases.


Figures

Figure 1.
Figure 1.
Albumin induces apoptosis and caspase activation in RPTC cells. (A) Representative images of cellular and nuclear morphology. RPTC cells were untreated (Control), treated with 20 mg/ml low-endotoxin BSA (Albumin), or treated with 20 mg/ml transferrin in serum-free medium for 24 hours. The cells were then stained with Hoechst 33342 to record cellular and nuclear morphology or were subjected to TUNEL staining. Magnification, ×400. (B) Dose dependence of albumin-induced apoptosis in RPTC cells. RPTC cells were incubated for 24 hours with 0 to 40 mg/ml albumin or 40 mg/ml transferrin in serum-free medium. The cells were then examined by microscopy to count cells with typical apoptotic morphology to determine the percentage of apoptosis. (C) Time course of albumin-induced apoptosis in RPTC cells. RPTC cells were treated with 20 mg/ml albumin for 0 to 24 hours. Apoptosis was quantified by morphologic methods. (n = 5). (D) Caspase activation during albumin incubation of RPTC cells. RPTC cells were incubated with 20 mg/ml albumin for indicated durations in the absence or presence of 50 μM Z-VAD to collect lysate for measurement of caspase activity. (E) Inhibition of albumin-induced apoptosis by Z-VAD. RPTC cells were incubated with 20 mg/ml albumin for indicated durations in the absence or presence of 50 μM Z-VAD. Apoptosis was evaluated by counting the cells with typical apoptotic morphology. Data in B to E are expressed as mean ± SD, n = 5. In B and C, aP < 0.01 versus control (0 mg/ml albumin). In D and E, bP < 0.01 between two compared groups.
Figure 2.
Figure 2.
Bcl-2 suppresses albumin-induced RPTC apoptosis and cytochrome c release. RPTCs and Bcl-2-transfected RPTCs were incubated with or without 20 mg/ml albumin for 24 h. (A) Cytochrome c release. The cells were fractionated to obtain cytosolic fractions for immunoblot analysis of cytochrome c (Cyt. c). The blots were reprobed for β-actin to control protein loading and transferring. (B) Percentage of apoptosis. Apoptosis was evaluated by morphologic methods (n = 5). (C) Caspase activity. Cell lysates were collected to determine caspase activity by an enzymatic assay (n = 4). Data in B and C are expressed as mean ± SD, n = 4 to 5. cP < 0.01 between the compared two groups.
Figure 3.
Figure 3.
Albumin stimulates PKC-δ Tyr-311 phosphorylation during albumin treatment. (A) Time course of albumin-induced PKC-δ Tyr-311 phosphorylation. RPTCs were treated with 20 mg/ml albumin for indicated durations to collect whole-cell lysates for immunoblot analysis of Tyr-311-phosphorylated PKC-δ, total PKC-δ, and β-actin. (B) Dose dependence of albumin-induced PKC-δ Tyr-311 phosphorylation. RPTCs were incubated with the indicated concentrations of albumin or 40 mg/ml transferrin for 12 hours to collect whole-cell lysates for immunoblot analysis of Tyr-311-phosphorylated PKC-δ, total PKC-δ, and β-actin. (C) Densitometry analysis of albumin-induced PKC-δ Tyr-311 phosphorylation. Immunoblots from three separate experiments were analyzed by densitometry. The results were normalized with the value of the control (0 mg/ml albumin), which was arbitrarily set as 100. Data are expressed as mean ± SD, n=3. dP < 0.05 compared with control; eP < 0.01 compared with control.
Figure 4.
Figure 4.
Rottlerin inhibits albumin-induced RPTC apoptosis and PKC-δ Tyr-311 phosphorylation. (A) RPTCs were incubated with 20 mg/ml albumin for 24 hours with 0 to 4 μM Rottlerin. Apoptosis was evaluated by morphologic methods. (B) Cell lysates were collected to determine caspase activity by an enzymatic assay. (C) RPTCs were incubated for 12 hours without (−) or with (+) 20 mg/ml albumin in the absence (−) or presence (+) of 1 μM Rottlerin. Whole-cell lysates were collected for immunoblot analysis of Tyr-311-phosphorylated PKC-δ, total PKC-δ, and β-actin. (D) RPTCs were incubated with 20 mg/ml albumin for 24 hours. Rottlerin (1 μM) was added at 0, 8, 12, or 16 hours of albumin treatment. Another group of cells was treated with albumin only without Rottlerin. Apoptosis was evaluated by morphologic methods. Data in A to C are expressed as mean ± SD, n = 3. fP < 0.05 and gP < 0.01 versus albumin-only group.
Figure 5.
Figure 5.
Rottlerin inhibits Bax translocation and cytochrome c (Cyt. c) release during albumin treatment of RPTCs. RPTCs were incubated with 20 mg/ml albumin in the absence or presence of 1 μM Rottlerin. The cells were harvested at indicated time points for fractionation. Cytosolic and mitochondrial fractions of the cells were subjected to immunoblot analysis of Bax (A) and cytochrome c (B).
Figure 6.
Figure 6.
Dominant negative PKC suppresses albumin-induced RPTC apoptosis. RPTCs were cotransfected with pEGFP-C3 and dominant-negative PKC-δ (dn-PKC-δ), dominant-negative PKC-α (dn-PKC-α), or empty pcDNA3.1 vector. The cells were then incubated for 24 hours with 20 mg/ml albumin and stained with Hoechst 33342 for morphologic examination of apoptosis. (A) Representative cell morphology. Magnification, ×400. Arrows show transfected cells that showed typical apoptotic morphology. (B) Percentage of apoptosis in GFP-labeled transfected cells. Data are mean ± SD, n = 3. hP < 0.01 versus vector control.
Figure 7.
Figure 7.
Apoptosis induced by albumin overload in renal tissues requires PKC-δ. Male PKC-δ knockout mice and their wild-type littermates were injected with albumin at 10 mg/g body weight for 5 consecutive days per week for 6 weeks. Control animals received comparable volumes of saline. (A) At the end of albumin injections, kidney tissues were collected for immunoblot analysis of Tyr-311-phosphorylated PKC-δ and total PKC-δ. The blot was reprobed for cyclophilin B to monitor protein loading and transferring. (B) Kidneys were fixed in 4% paraformaldehyde and paraffin embedded for TUNEL assay. Apoptosis in renal tissues was quantified by counting the total of TUNEL-positive cells in 20 random fields at the magnification of ×200. Data are mean ± SD, n = 3. kP < 0.01, WT versus KO. (C) Representative images of TUNEL assay. Hoechst 33342 costaining was performed at the end of TUNEL staining to identify the nuclei. Magnification: ×400 in images; ×850 in inserts. Arrows show nuclei with positive TUNEL staining. Insets show TUNEL-positive nuclei at high magnifications.

Comment in

References

    1. Abbate M, Zoja C, Remuzzi G: How does proteinuria cause progressive renal damage? J Am Soc Nephrol 17: 2974–2984, 2006 - PubMed
    1. Perico N, Benigni A, Remuzzi G: Present and future drug treatments for chronic kidney diseases: Evolving targets in renoprotection. Nat Rev Drug Discov 7: 936–953, 2008 - PubMed
    1. Strutz FM: EMT and proteinuria as progression factors. Kidney Int 75: 475–481, 2009 - PubMed
    1. Chang SS: Albuminuria and diabetic nephropathy. Pediatr Endocrinol Rev 5[Suppl 4]: 974–979, 2008 - PubMed
    1. Erkan E, De Leon M, Devarajan P: Albumin overload induces apoptosis in LLC-PK(1) cells. Am J Physiol Renal Physiol 280: F1107–F1114, 2001 - PubMed

Publication types

MeSH terms