Development of a prediction tool for low bone mass based on clinical data and periapical radiography
- PMID: 20395463
- PMCID: PMC3520227
- DOI: 10.1259/dmfr/23760876
Development of a prediction tool for low bone mass based on clinical data and periapical radiography
Abstract
Objectives: This study aimed to develop and test a tool for low bone mass pre-screening by combining periapical radiographs with clinical risk factors.
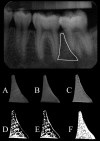
Methods: The study sample consisted of 60 post-menopausal women over 40 years of age who were referred for dental radiographs. These patients also had their bone mineral density measured at the lumbar spine and proximal femur using dual-energy X-ray absorptiometry. Radiographic density measurements and 14 morphological features were obtained from each dental radiograph using digital image processing software. The clinical variables considered were age and bone mass index. Classification and regression tree analysis (CART) was used to test the predictive power of clinical and radiographic risk factors for classifying individuals.
Results: CART indicated that the most important variables for classifying patients were age, number of terminal points/periphery, periphery/trabecular area, radiographic density and bone mass index.
Conclusion: A combination of clinical and radiographic factors can be used to identify individuals with low bone mineral density, with higher accuracy than any one of these factors taken individually.
Figures


References
-
- Lindsay R, Christiansen C, Einhorn TA, Mckay HD, Ljunghall S, Mutalen CA. Who are candidates for prevention and treatment for osteoporosis? Osteoporos Int 1997;7:1–6 - PubMed
-
- Lenchik L, Sartoris DJ. Current concepts in osteoporosis. Am J Roentgenol 1997;168:905–911 - PubMed
-
- WHO scientificgroupassessmentoffractureriskanditsimplicationstoscreeningforpostmenopausalosteoporosis WHO technical report series 843 1994 Geneva.
-
- Consensus Conference: osteoporosis. JAMA 1984;252:799–802 - PubMed
-
- Dargent-Molina P, Piaults S, Bréart G. A triage strategy based on clinical risk factors for selecting elderly women for treatment or bone densitometry: the EPIDOS prospective study. Osteoporos Int 2005;16:898–906 - PubMed
MeSH terms
LinkOut - more resources
Full Text Sources
Medical

