

Glycosylation variants of mucins and CEACAMs as candidate biomarkers for the diagnosis of pancreatic cystic neoplasms
- PMID: 20395854
- PMCID: PMC3713623
- DOI: 10.1097/SLA.0b013e3181d7738d
Glycosylation variants of mucins and CEACAMs as candidate biomarkers for the diagnosis of pancreatic cystic neoplasms
Abstract
Background and aims: Cystic lesions of the pancreas are increasingly being recognized due to the widespread use of high resolution abdominal imaging. Since certain cyst types are precursors to invasive cancer, this situation presents an opportunity to intervene prior to malignant progression. Effective implementation of that strategy has been hampered by difficulties in clearly distinguishing cystic lesions with no malignant potential from those with malignant potential. Here we explored whether glycosylation variants on specific proteins in cyst fluid samples could serve as biomarkers to aid in this diagnosis.
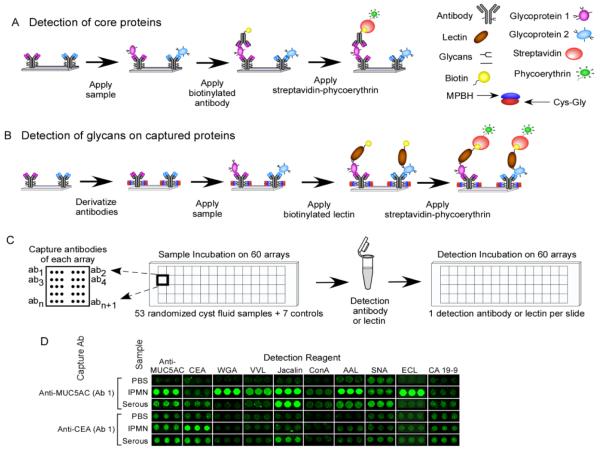
Methods: We used a novel antibody-lectin sandwich microarray method to measure the protein expression and glycosylation of mucin (MUC)1, MUC5AC, MUC16, carcinoembryonic antigen, and other proteins implicated in pancreatic neoplasia in cyst fluid samples. Fifty-three cyst fluid samples were obtained from patients with mucinous cystic neoplasms (n=17), intraductal papillary mucinous neoplasms (n=15), serous cystadenomas (n=12), or pseudocysts (n=9), with confirmation of histologic diagnosis at surgical resection.
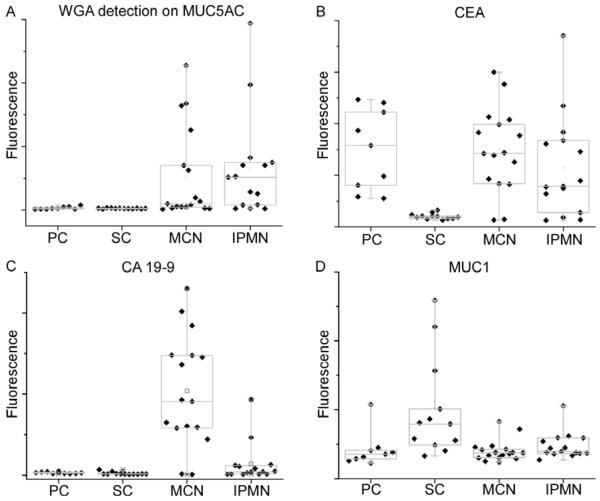
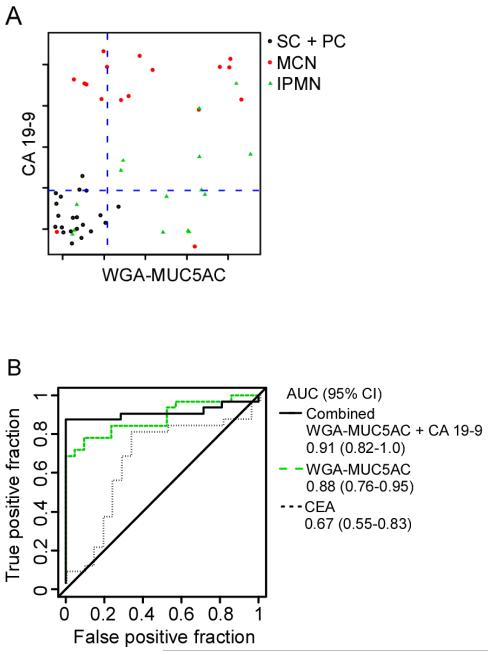
Results: The detection of a glycan variant on MUC5AC using the lectin wheat-germ agglutinin discriminated mucin-producing cystic tumors (mucinous cystic neoplasms+intraductal papillary mucinous neoplasms) from benign cystic lesions (serous cystadenomas+pseudocysts) with a 78% sensitivity at 80% specificity, and when used in combination with cyst fluid CA 19-9 gave a sensitivity of 87% at 86% specificity. These biomarkers performed better than cyst fluid carcinoembryonic antigen (37%/80% sensitivity/specificity).
Conclusions: These results demonstrate the value of glycan variants for biomarker discovery and suggest that these biomarkers could greatly enhance the accuracy of differentiating pancreatic cystic tumors. Validation studies will be required to determine the clinical value of these markers.
Figures
Similar articles
-
Cyst fluid analysis obtained by EUS-guided FNA in the evaluation of discrete cystic neoplasms of the pancreas: a prospective single-center experience.Gastrointest Endosc. 2006 Nov;64(5):697-702. doi: 10.1016/j.gie.2006.01.070. Gastrointest Endosc. 2006. PMID: 17055859
-
The mistletoe and cyst-fluid analysis: a sticky insight.Gastrointest Endosc. 2006 Nov;64(5):703-4. doi: 10.1016/j.gie.2006.04.019. Gastrointest Endosc. 2006. PMID: 17055860 No abstract available.
-
Cyst fluid analysis in the differential diagnosis of pancreatic cysts. A comparison of pseudocysts, serous cystadenomas, mucinous cystic neoplasms, and mucinous cystadenocarcinoma.Ann Surg. 1993 Jan;217(1):41-7. doi: 10.1097/00000658-199301000-00008. Ann Surg. 1993. PMID: 8424699 Free PMC article.
-
Role of tumor markers in the diagnosis of cystic and intraductal neoplasms.Gastrointest Endosc Clin N Am. 2002 Oct;12(4):791-801. doi: 10.1016/s1052-5157(02)00025-9. Gastrointest Endosc Clin N Am. 2002. PMID: 12607788 Review.
-
Simple mucinous cyst: another potential cancer precursor in the pancreas? Case report with molecular characterization and systematic review of the literature.Virchows Arch. 2021 Jul;479(1):179-189. doi: 10.1007/s00428-021-03029-1. Epub 2021 Jan 28. Virchows Arch. 2021. PMID: 33511431 Free PMC article.
Cited by
-
Interdisciplinary management of cystic neoplasms of the pancreas.Gastroenterol Res Pract. 2012;2012:513163. doi: 10.1155/2012/513163. Epub 2012 Oct 21. Gastroenterol Res Pract. 2012. PMID: 23133446 Free PMC article.
-
Atypical Mucin Expression Predicts Worse Overall Survival in Resectable Pancreatic Ductal Adenocarcinoma.J Immunol Res. 2022 Jul 21;2022:7353572. doi: 10.1155/2022/7353572. eCollection 2022. J Immunol Res. 2022. PMID: 35910854 Free PMC article.
-
Pancreatic cancer in 2021: What you need to know to win.World J Gastroenterol. 2021 Sep 21;27(35):5851-5889. doi: 10.3748/wjg.v27.i35.5851. World J Gastroenterol. 2021. PMID: 34629806 Free PMC article. Review.
-
Early Detection of Pancreatic Cancer: Opportunities and Challenges.Gastroenterology. 2019 May;156(7):2024-2040. doi: 10.1053/j.gastro.2019.01.259. Epub 2019 Feb 2. Gastroenterology. 2019. PMID: 30721664 Free PMC article. Review.
-
Differentiation of mucinous from non-mucinous pancreatic cyst fluid using dual-stained, 1 dimensional polyacrylamide gel electrophoresis.Clin Proteomics. 2014 Dec 1;11(1):42. doi: 10.1186/1559-0275-11-42. eCollection 2014. Clin Proteomics. 2014. PMID: 25838813 Free PMC article.
References
-
- Sohn TA, Yeo CJ, Cameron JL, et al. Resected adenocarcinoma of the pancreas-616 patients: results, outcomes, and prognostic indicators. J Gastrointest Surg. 2000;4(6):567–79. - PubMed
-
- Singh M, Maitra A. Precursor lesions of pancreatic cancer: molecular pathology and clinical implications. Pancreatology. 2007;7(1):9–19. - PubMed
-
- Canto MI, Goggins M, Hruban RH, et al. Screening for early pancreatic neoplasia in high-risk individuals: a prospective controlled study. Clin Gastroenterol Hepatol. 2006;4(6):766–81. quiz 665. - PubMed
-
- Wilentz RE, Albores-Saavedra J, Zahurak M, et al. Pathologic examination accurately predicts prognosis in mucinous cystic neoplasms of the pancreas. Am J Surg Pathol. 1999;23(11):1320–7. - PubMed
-
- Hruban RH, Goggins M, Parsons J, et al. Progression model for pancreatic cancer. Clin Cancer Res. 2000;6(8):2969–72. - PubMed
Publication types
MeSH terms
Substances
Grants and funding
LinkOut - more resources
Full Text Sources
Other Literature Sources
Medical
Research Materials
Miscellaneous
