

Review
doi: 10.1038/nrg2760.
Genome-wide association studies in diverse populations
Affiliations
- PMID: 20395969
- PMCID: PMC3079573
- DOI: 10.1038/nrg2760
Item in Clipboard
Review
Genome-wide association studies in diverse populations
Nat Rev Genet.
2010 May.
Abstract
Genome-wide association (GWA) studies have identified a large number of SNPs associated with disease phenotypes. As most GWA studies have been performed in populations of European descent, this Review examines the issues involved in extending the consideration of GWA studies to diverse worldwide populations. Although challenges exist with issues such as imputation, admixture and replication, investigation of a greater diversity of populations could make substantial contributions to the goal of mapping the genetic determinants of complex diseases for the human population as a whole.
Figures
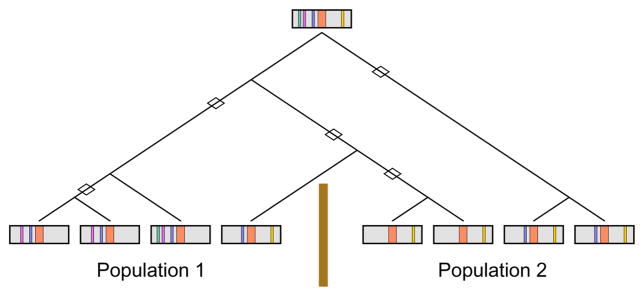
A disease mutation (orange) occurs on an ancestral chromosome that contains several marker alleles (green, purple, blue, yellow). Over time, recombination events (diamonds) break down the correlations between the disease mutation and the marker alleles. However, the recombination history differs for populations 1 and 2, separated by a barrier to gene flow (brown line). Consequently, if the purple or blue allele were examined in population 1, then a disease association might be found, but it might not be found in population 2. A similar situation applies for the yellow allele, with the roles of the populations reversed. The figure and caption are modified from Rosenberg and VanLiere.
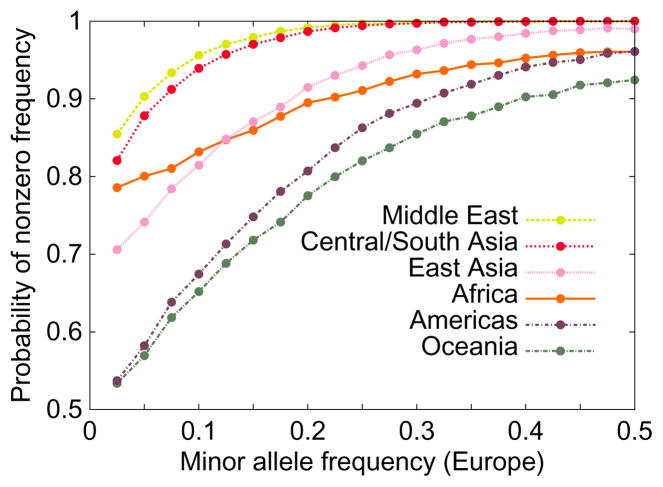
The figure illustrates that alleles that are more common in one group, in this case Europeans, are more likely to be present in other groups. It also shows that populations that are geographically closer to Europe, such as populations of the Middle East, tend to have more alleles shared with Europeans than more geographically distant populations, such as those of Oceania. The figure is based on the SNP data underlying Figure S21 of Jakobsson et al. , which uses 512,762 autosomal SNPs in indigenous populations from the Human Genome Diversity Panel, and which standardizes sample sizes across groups by evaluating allele frequencies in samples of size 40.
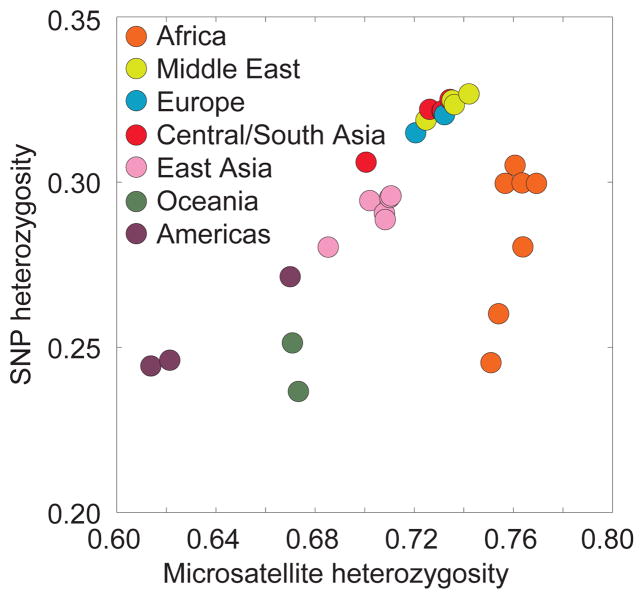
The y-axis depicts mean heterozygosity across loci in 443 individuals from 29 populations, on the basis of 512,762 autosomal SNPs from an Illumina genotyping panel. The x-axis depicts mean heterozygosity in the same individuals, on the basis of 783 autosomal microsatellite markers,. Because individual microsatellites, unlike SNPs, are highly variable, microsatellite ascertainment is less dependent on the initial ascertainment sample than is SNP ascertainment. Thus, the imperfect correlation of SNP heterozygosity with microsatellite heterozygosity might reflect ascertainment bias in the SNP set. This figure is similar to Figure 3 of Conrad et al. .
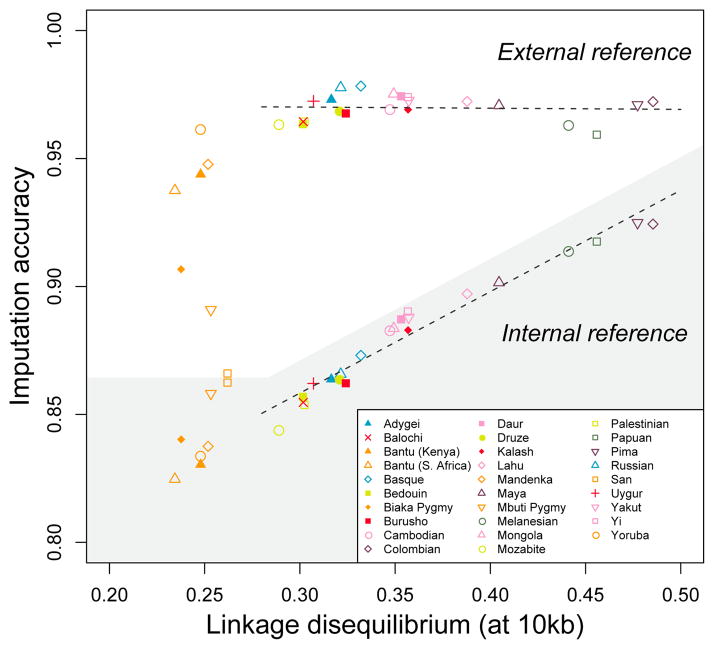
Imputation accuracy is plotted as a function of LD measured by mean r2 at a distance of 10 kb in a genome-wide dataset. Genotypes in a genome-wide study are hidden and then imputed, with two different designs. In the shaded region, genotypes in each population are imputed without an external reference panel, so that the information for imputing “missing” genotypes comes from other individuals in the population. In the unshaded region, genotypes in the population are imputed using an external reference panel, chosen optimally among 36 mixtures of the HapMap CEU (European American), CHB+JPT (Chinese and Japanese), and YRI (Yoruba) panels. Color coding for populations follows that of Fig. 3. The regression lines exclude the African populations, and they have coefficients of determination 0.003 (external reference) and 0.953 (internal reference). The figure shows that imputation accuracy based on an internal reference is highly correlated with LD. However, imputation accuracy based on an external reference is not correlated with LD (and instead depends on the composition of the particular reference panels available). The figure is based on the data in scenarios 1, 3, and 6 in Table 1 of Huang et al. .
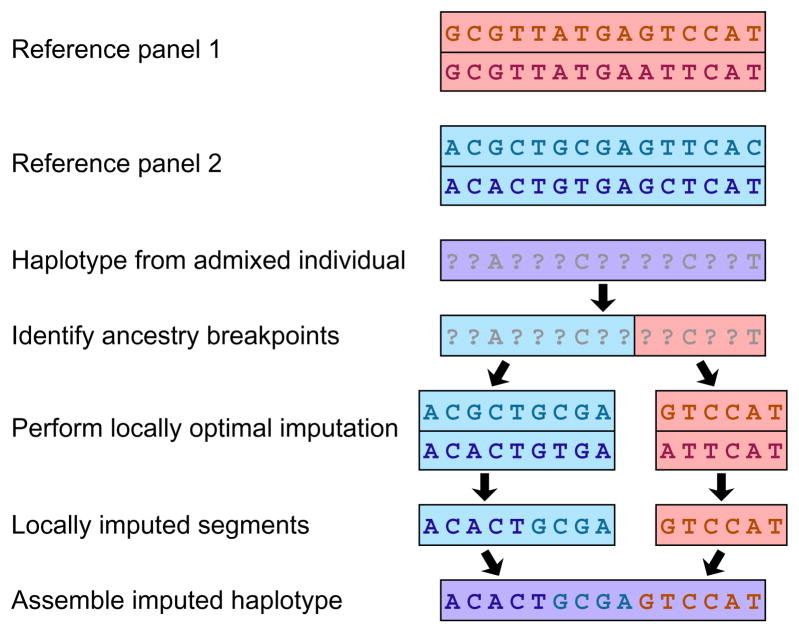
Admixture segments are estimated in each individual sampled from a GWA study. Consider reference haplotypes from two separate panels (red and blue boxes). Separately for each admixture segment of a haplotype, alleles are imputed using reference haplotypes from the same population as the inferred source. Within a source population, a haplotype might have alleles imputed from multiple reference haplotypes, as depicted on the left with both haplotypes from the same (blue) source population serving as imputation templates. If admixture estimates for a segment are uncertain, then conditional imputations at a site given each of the possible source populations for the segment can be weighted by the probabilities of those sources.
References
Publication types
MeSH terms
Grants and funding
LinkOut - more resources
Full Text Sources
Research Materials
