Comparative Study
. 2010 Mar 15;2(2):e00030.
doi: 10.1042/AN20090048.

Hyperglycaemia and diabetes impair gap junctional communication among astrocytes

Affiliations
Comparative Study

Hyperglycaemia and diabetes impair gap junctional communication among astrocytes

Gautam K Gandhi et al. ASN Neuro. .

Abstract

Sensory and cognitive impairments have been documented in diabetic humans and animals, but the pathophysiology of diabetes in the central nervous system is poorly understood. Because a high glucose level disrupts gap junctional communication in various cell types and astrocytes are extensively coupled by gap junctions to form large syncytia, the influence of experimental diabetes on gap junction channel-mediated dye transfer was assessed in astrocytes in tissue culture and in brain slices from diabetic rats. Astrocytes grown in 15-25 mmol/l glucose had a slow-onset, poorly reversible decrement in gap junctional communication compared with those grown in 5.5 mmol/l glucose. Astrocytes in brain slices from adult STZ (streptozotocin)-treated rats at 20-24 weeks after the onset of diabetes also exhibited reduced dye transfer. In cultured astrocytes grown in high glucose, increased oxidative stress preceded the decrement in dye transfer by several days, and gap junctional impairment was prevented, but not rescued, after its manifestation by compounds that can block or reduce oxidative stress. In sharp contrast with these findings, chaperone molecules known to facilitate protein folding could prevent and rescue gap junctional impairment, even in the presence of elevated glucose level and oxidative stress. Immunostaining of Cx (connexin) 43 and 30, but not Cx26, was altered by growth in high glucose. Disruption of astrocytic trafficking of metabolites and signalling molecules may alter interactions among astrocytes, neurons and endothelial cells and contribute to changes in brain function in diabetes. Involvement of the microvasculature may contribute to diabetic complications in the brain, the cardiovascular system and other organs.

Keywords: 4-PBA, 4-phenylbutyric acid; 6-NBDG, 6-[N-(7-nitrobenz-2-oxa-1,3-diazol-4-yl)amino]-2-deoxyglucose; Cx, connexin; DCF, 2′,7′-dichlorodihydrofluorescein; DIC, differential interference contrast; DMEM, Dulbecco's modified Eagle's medium; ER, endoplasmic reticulum; FBS, fetal bovine serum; LYCH, Lucifer Yellow CH; LYVS, Lucifer Yellow VS; MnTBAP, manganese(III) tetrakis (4-benzoic acid) porphyrin chloride; NA, numerical aperture; NOS, nitric oxide synthase; PKC, protein kinase C; RNS, reactive nitrogen species; ROS, reactive oxygen species; STZ, streptozotocin; TMAO, trimethylamine N-oxide dihydrate; TUDCA, tauroursodeoxycholic acid; aCSF, artificial cerebrospinal fluid; astrocyte; carboxy-DCF-DA, carboxy DCF diacetate; connexin (Cx); dBcAMP, dibutyryl cAMP; diabetes; gap junction; hyperglycaemia; l-NAME, l-Nω-nitro-l-arginine methyl ester; streptozotocin.


Figures

Figure 1
Figure 1. Growth of astrocytes in high glucose reduces gap junctional communication
(A) Cultured astrocytes were grown in low or high glucose for 21 days, and gap junctional transfer of LYVS (1 mmol/l) was assayed by dye transfer after scrape loading. The scrapes are in the centre of each panel, and the scale bar (100 μm) applies to both panels. (B) Line scan analysis (using a 100 μm bar and MetaVue software) of Lucifer Yellow fluorescence as a function of distance from the scrape; the white lines are the means for three assays and shaded areas represent ±1 S.D. (C) Dye-labelled area assayed in the absence (n = 15 for 5.5 mmol/l glucose; n = 9 for 25 mmol/l glucose) or presence (n = 4) of octanol (final concentration 0.6 mmol/l, 10 min) to block gap junctions; values are means and vertical bars are 1 S.D. The Lucifer Yellow-labelled area was calculated as the difference in areas labelled by Lucifer Yellow and rhodamine–dextran (1 mmol/l), a gap junction-impermeant tracer that labels only the scrape-loaded cells. ***P<0.001; NS, not significantly different; ANOVA and the Bonferroni test.
Figure 2
Figure 2. Slow onset of dye transfer impairment in severely hyperglycaemic astrocytes
Representative DIC images of astrocytes grown in 5.5 mmol/l (A) or 25 mmol/l (B) glucose for 14 days; images of nuclei that were stained with Hoechst dye are superimposed on the DIC images. Similar cell densities were found in the low-glucose (44±8 cells per field) and high-glucose (42±15 cells per field) cultures when the numbers of nuclei were counted on day 14 in images of different cultures in 15 random fields of view (i.e. 200 μm×200 μm with a ×40 objective) per group. Dye-transfer was assayed by impaling a single astrocyte in different groups of cells with a micropipette, the dye was diffused into the cell for 2 min and the labelled area was measured (CF). Representative images (C, D) illustrate diffusion of LYVS among astrocytes grown for 21 days in 5.5 mmol/l (C) or 25 mmol/l (D) glucose; arrows identify the impaled cell. The scale bars in (B) and (D) are 50 μm and also apply to images in (A) and (C). Dependence of Lucifer Yellow-labelled area on duration of growth at various glucose concentrations (E). The respective number of samples per group is as follows: 5.5 mmol/l glucose, n = 7, 17, 6, 12, 16, 21, 10 and 21 at 1, 3, 5, 7, 10, 14, 17 and 21 days; 15 mmol/l glucose, n = 20, 20, 20, 18 at 3, 7, 14 and 21 days; 25 mmol/l glucose, n = 8, 18, 6, 14, 17, 21, 16, 23 at 1, 3, 5, 7, 10, 14, 17 and 21 days. Alexa Fluor® 350 (A350)-labelled area declines with time in high-glucose-containing medium (F). The respective number of samples per group at 1, 3, 5, 7, 10, 14, 17 and 21 days is as follows: 5.5 mmol/l glucose, n = 6, 6, 7, 12, 18, 13, 12 and 11; 25 mmol/l glucose, n = 6, 8, 6, 12, 19, 12, 10 and 12. Cells in each experimental group were derived from at least three independent cultures. Values are means and vertical bars represent 1 S.D.; bars that are smaller than the symbol are not visible. *P<0.05, **P<0.01, ***P<0.001, for the indicated comparisons using the unpaired, two-tailed t test for two groups, and ANOVA and Dunnett's test for multiple comparisons against the respective 5.5 mmol/l glucose group.
Figure 3
Figure 3. Glycaemic control does not reverse the deficit previously acquired during growth in hyperglycaemic conditions
Cultured astrocytes were grown in medium containing the indicated glucose concentrations for 14 days. Then the cells grown in 15 or 25 mmol/l glucose were also cultured in medium containing 5.5 mmol/l glucose, and all cultures continued for an additional 7 or 14 days. At the time intervals indicated, dye transfer was assayed by impaling a single astrocyte with a micropipette, dye was diffused into the cell for 2 min and labelled area was measured. The respective number of samples/group at 21 and 28 days is as follows: 5.5 mmol/l glucose, n = 20 and 10; 15 mmol/l glucose, n = 10 and 10; and 25 mmol/l glucose, n = 20 and 10. Cells in each experimental group were derived from at least three independent cultures. Values are means and vertical bars represent 1 S.D.; when bars are not visible, they are smaller than the symbol. *P<0.05, **P<0.01, ***P<0.001, for the indicated comparisons using ANOVA and Dunnett's test for multiple comparisons against the respective 5.5 mmol/l glucose group.
Figure 4
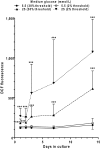
Figure 4. Oxidative stress is detectable after 1 day of severe hyperglycaemia and remains elevated
Cultured astrocytes were grown in media containing 5.5 or 25 mmol/l glucose for 14 days. ROS/RNS production was assayed by DCF fluorescence (30 min incubation in 10 μmol/l DCFDA) and quantified using MetaVue software, with thresholding to include either the highest 2% or 30% fluorescence intensities; thresholding at 30% excluded the background and thresholding at 2% quantified the small ‘hot spots’ that are readily visible in the images. The values thresholded at 2% and 30% were similar for cells grown in 5.5 mmol/l glucose; comparisons between the cells grown in 5.5 or 25 mmol/l glucose were made for each respective threshold value. Endogenous fluorescence in the absence of DCF was 114±3 (30% threshold) and 123±5 (2% threshold) for cells grown in 5.5 mmol/l glucose for 3 or 7 days, and slightly lower values were obtained for cells grown in 25 mmol/l glucose (results not shown). These control values for endogenous fluorescence were not subtracted from those in which DCF was added to assay NOS/ROS production, indicating that generation of DCF fluorescence by reactive species in low-glucose media is very low. The respective number of samples per group at 1, 2, 3, 7 and 14 days is as follows: 5.5 mmol/l glucose, n = 30, 29, 30, 30 and 45; 25 mmol/l glucose, n = 20, 17, 29, 15 and 35. Each sample represents analyses of images (200μm ×200 μm) of astrocytes grown on coverslips; results are from up to ten images per coverslip and three to five coverslips per group. Cells in each experimental group were derived from at least three independent cultures. Values are means and vertical bars represent 1 S.D.; when bars are not visible, they are smaller than the symbol. ***P<0.001, for the indicated comparisons using the unpaired, two-tailed t test against the respective 5.5 mmol/l glucose group.
Figure 5
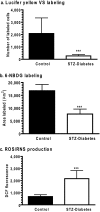
Figure 5. Reduced dye transfer among astrocytes in brain slices from STZ-diabetic rats compared with controls
Gap junctional communication was assayed in slices of inferior colliculus from age-matched, vehicle-injected controls (A, C) and STZ-diabetic rats at 20–24 weeks after the onset of diabetes (B, D). A single astrocyte was impaled with a micropipette containing either Lucifer Yellow (A, B) or 6-NBDG (C, D), and the dye was diffused into the cell for 5 min. The Lucifer Yellow was a mixture of LYVS (4 g/100 ml)+LYCH (4 g/100 ml). 6-NBDG (5 mmol/l) is a non-metabolizable fluorescent analogue of glucose. The scale bars in (A, B) are 200 μm (imaged with a ×10 objective), and those in (C, D) are 40 μm (imaged with a ×40 objective). Arrows in (C, D) indicate the NBDG-containing micropipette.
Figure 6
Figure 6. Gap junctional communication and oxidative stress in brain slices from control and STZ-diabetic rats
Dye transfer was assayed in slices of inferior colliculus from adult male rats at 20–24 weeks after the onset of STZ-induced diabetes and in age-matched, vehicle-injected controls by impaling a single astrocyte with a tracer-containing micropipette and diffusing the tracer for 5 min (for more details, see the legend to Figure 5). (A) Cells labelled with LYVS+LYCH (n = 19, with 1 injection into each of 19 brain slices derived from 4 control rats and 19 slices from four diabetic rats). (B) Area labelled with 6-NBDG (n = 20 injections into ten slices from five control rats and 16 injections into eight slices from four diabetic rats). Note that the NBDG-labelled areas were measured in slices while viewing with a ×40 objective because the area labelled in the STZ-rat slices was difficult to determine with a ×10 objective; the NBDG-labelled area in the control rats was, therefore, probably underestimated (see Figure 5) and the difference between control and diabetic rats is likely to be greater than shown in (B). (C) Formation of ROS/RNS species in slices of inferior colliculus from control (n = 10) and STZ-diabetic (n = 8) rats was assayed as carboxy-DCF fluorescence. ***P<0.001, unpaired, two-tailed t tests.
Figure 7
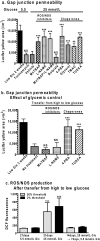
Figure 7. Influence of ROS/NOS inhibitors and chemical chaperones on dye transfer and DCF fluorescence
(A) Dye transfer after diffusion into a single cell for 2 min was assayed in astrocytes grown in high glucose for 14 days in the presence of various compounds that were added to the culture medium at the onset of culture in high glucose or (B) after 2 weeks growth in high glucose, followed by culture for 1 week in low-glucose medium that contained inhibitors or chaperones. For reference, the dye-labelled area obtained in low-glucose cultures grown for 2 weeks (results from Figure 2E) are included in (A), and that from low-glucose cultures at 3 weeks (results from Figure 3) are included in (B). However, statistical comparisons did not include these data to avoid additional multiple comparisons against the same data sets in other Figures. (C) DCF fluorescence was assayed in astrocytes after 3 weeks growth in low or high glucose (Glc) or 2 weeks in only high-glucose media followed by 1 week in low glucose. DCF fluorescence was thresholded at 30% or 2% of fluorescence intensity as described in the caption of Figure 4 to quantify the overall response and ‘hot spots’ respectively. Values are means and vertical bars represent 1 S.D. Statistical comparisons, denoted as NS, not significant; *P<0.05; **P<0.01; ***P<0.001, were as follows. In (A), multiple comparisons were made with ANOVA and Dunnett's test against the vehicle-treated 25 mmol/l glucose culture [n = 25, 13, 24, 22, 5, 15, 25, 12, 8 and 5 for the vehicle (0.1 mol/l PBS), MnTBAP (50 μmol/l), l-NAME (1 mmol/l), MnTBAP (50 μmol/l)+l-NAME (1 mmol/l), tunicamycin (100 ng/ml for 16 h), butyrate (1 mmol/l), 4-PBA (1 mmol/l), glycerol (25 mmol/l), TMAO (100 mmol/l) and TUDCA (25 mmol/l) groups respectively]. In (B), comparisons were made against the no-treatment group that was transferred from high to low glucose (n = 20, 10, 10, 12 and 8 for the no treatment, MnTBAP, l-NAME, 4-PBA and TUDCA groups respectively). In (C), comparisons were against the 5.5 mmol/l glucose group (n = 30 for 21 day/5.5 mmol/l; n = 20 for 21 day/25 mmol/l; n = 30 for 14 day/25 mmol/l followed by 7 day/5.5 mmol/l).
Figure 8
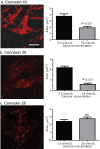
Figure 8. Effect of hyperglycaemia on staining of immunoreactive Cx proteins in cultured astrocytes
Composite z-stacks of confocal images (left column) of immunostained astrocytes showed a low-intensity background and prominent staining of punctate or vesicular immunoreactive material that appeared to be mainly intracellular. This morphological appearance of immunostaining was evident for Cx43 (A), Cx30 (B) and Cx26 (C) protein in astrocytes grown on coverslips for 14 days in a medium containing 5.5 mmol/l glucose; the scale bar is 12.5 μm and applies to all panels. Areas of these immunostained punctate/vesicular objects (right columns) are means (vertical bars represent 1 S.D.) from the following numbers of objects per group: Cx43, 5.5 mmol/l: n = 752 objects in cells on five coverslips; 25 mmol/l: n = 884 objects in cells on five coverslips; Cx30, 5.5 mmol/l: n = 1099 objects, five coverslips; 25 mmol/l: n = 1177 objects, five coverslips; Cx26, 5.5 mmol/l: n = 514 objects, four coverslips; and 25 mmol/l: n = 974 objects, five coverslips.

Similar articles

Cited by

References

    1. Abe T, Takahashi S, Suzuki N. Oxidative metabolism in cultured rat astroglia: effects of reducing the glucose concentration in the culture medium and of d-aspartate or potassium stimulation. J Cereb Blood Flow Metab. 2006;26:153–160. - PubMed
    1. Allen KV, Frier BM, Strachan MW. The relationship between type 2 diabetes and cognitive dysfunction: longitudinal studies and their methodological limitations. Eur J Pharmacol. 2004;490:169–175. - PubMed
    1. Ball KK, Gandhi GK, Thrash J, Cruz NF, Dienel GA. Astrocytic connexin distributions and rapid, extensive dye transfer via gap junctions in the inferior colliculus: implications for [14C]glucose metabolite trafficking. J Neurosci Res. 2007;85:3267–3283. - PMC - PubMed
    1. Beltramello M, Piazza V, Bukauskas FF, Pozzan T, Mammano F. Impaired permeability to Ins(1,4,5)P3 in a mutant connexin underlies recessive hereditary deafness. Nat Cell Biol. 2005;7:63–69. - PubMed
    1. Biessels GJ, Gispen WH. The impact of diabetes on cognition: what can be learned from rodent models? Neurobiol Aging. 2005;26 (Suppl. 1):36–41. - PubMed

Publication types