Review
. 2010 Sep;9(3):352-74.
doi: 10.1007/s12311-010-0168-7.

Rebound discharge in deep cerebellar nuclear neurons in vitro

Affiliations
Review

Rebound discharge in deep cerebellar nuclear neurons in vitro

Reza Tadayonnejad et al. Cerebellum. 2010 Sep.

Abstract

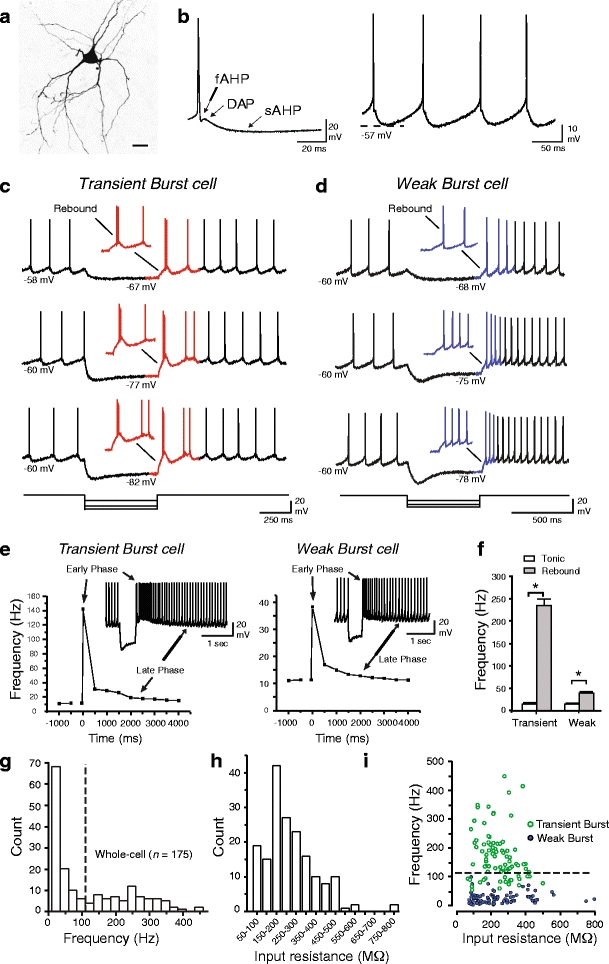
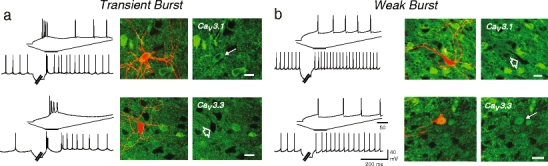
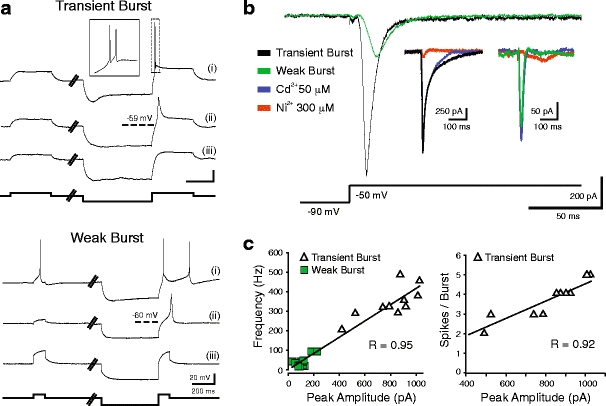
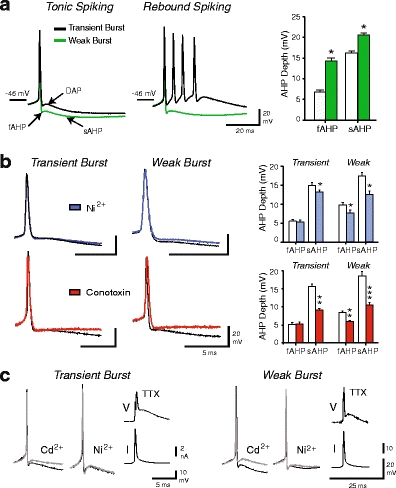
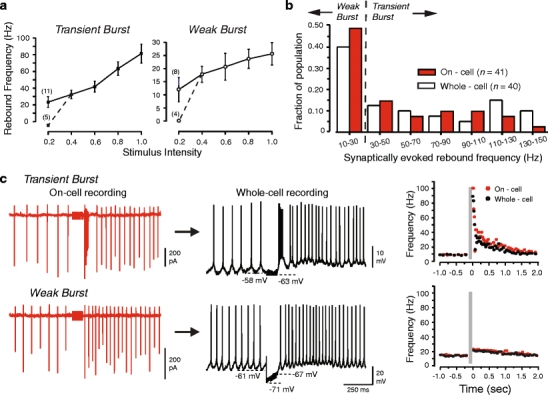
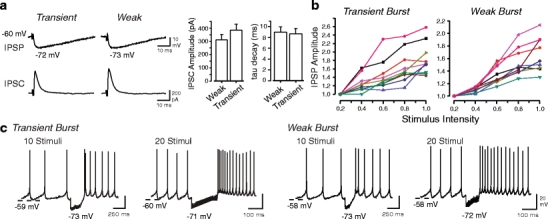
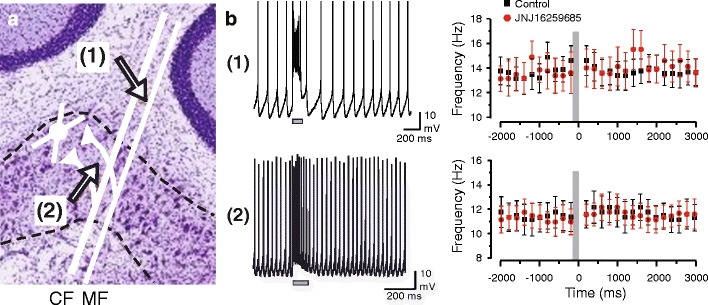
Neurons of the deep cerebellar nuclei (DCN) play a critical role in defining the output of cerebellum in the course of encoding Purkinje cell inhibitory inputs. The earliest work performed with in vitro preparations established that DCN cells have the capacity to translate membrane hyperpolarizations into a rebound increase in firing frequency. The primary means of distinguishing between DCN neurons has been according to cell size and transmitter phenotype, but in some cases, differences in the firing properties of DCN cells maintained in vitro have been reported. In particular, it was shown that large diameter cells in the rat DCN exhibit two phenotypes of rebound discharge in vitro that may eventually help define their functional roles in cerebellar output. A transient burst and weak burst phenotype can be distinguished based on the frequency and pattern of rebound discharge immediately following a hyperpolarizing stimulus. Work to date indicates that the difference in excitability arises from at least the degree of activation of T-type Ca(2+) current during the immediate phase of rebound firing and Ca(2+)-dependent K(+) channels that underlie afterhyperpolarizations. Both phenotypes can be detected following stimulation of Purkinje cell inhibitory inputs under conditions that preserve resting membrane potential and natural ionic gradients. In this paper, we review the evidence supporting the existence of different rebound phenotypes in DCN cells and the ion channel expression patterns that underlie their generation.


Figures

Fig. 1
Fig. 1
Deep cerebellar cells exhibit two phenotypes of rebound discharge. a A biocytin-filled large diameter cell. b Expanded view of the fAHP, DAP, and sAHP recorded in large diameter neurons and an example of tonic firing near resting potential. c, d Representative recordings of rebound responses to a set of hyperpolarizing current steps in vitro. The immediate rebound responses are enlarged as insets and the initial rebound response is indicated in color. e Representative instantaneous frequency plots of rebound firing in transient and weak burst cells. Time 0 represents the end of a 500-ms hyperpolarizing step to −80 mV. Note the difference in scales for frequency between transient and weak burst cells. f Average values of the rate of tonic and rebound firing for transient (n = 47) and weak burst (n = 62) cells following a hyperpolarizing step to −90 mV (1 s, p < 0.05). g Plot of the maximum rebound burst frequencies of cells in response to a membrane hyperpolarization to −80 mV across all DCN nuclei (500 ms, n = 175, bin width 25 Hz). A bimodal distribution of frequencies appears, as supported by cluster analysis (squared Euclidian distance of 2). h Input resistance for all cells shown in g (bin width 50 MΩ). i Plot of the maximum rebound frequency recorded for cells in g and h in relation to input resistance. Dashed lines in g and i depict the approximate boundary between the two defined clusters of data points that range from 10 to 113 and 132 to 249 Hz. The data in a and f were modified from [7, 8]. The absolute membrane potentials at the trough of the AHP and during current-evoked hyperpolarizations are shown in b–d
Fig. 2
Fig. 2
Transient and weak Burst neurons are associated with select Cav3 T-type Ca2+ channel isoforms. a, b Shown are recordings from transient burst (a) and weak burst neurons (b) in vitro and filled with biocytin for identification with streptavidin-Cy3. Filled neurons represented two dimensional extended projections of up to 60 images in a confocal stack and immunolabels a single image at 0.5 µm separation. a Transient burst cells are associated with a positive immunolabel for Cav3.1 (solid arrow), but not Cav3.3 (open arrow). b Weak burst cells are negative for Cav3.1 immunolabel (open arrow), but positive for Cav3.3 (solid arrow). Scale bars, 20 µm. Modified from [7]
Fig. 3
Fig. 3
Transient and weak burst phenotypes express LVA Ca2+ current and low threshold Ca2+ spikes during rebound discharge. a Deep cerebellar neurons exhibit LVA Ca2+ spikes. Shown are recordings in normal ACSF with Na+ spike discharge intact (i), after addition of TTX (200 nM) and Cs+ (2 mM) (ii), or TTX, Cs+, and Ni2+ (1 mM) to block Ca2+-dependent responses (iii). Dashed lines denote the voltage threshold for the LVA Ca2+ spike (ii) that is fully blocked by Ni2+ (iii). b Representative examples of LVA Ca2+ current recorded under whole cell voltage clamp from a transient and weak burst cell. Insets show the effect of sequential perfusion of Ca2+ channel blockers, with no effect by 50 µM Cd2+ (blue trace) but a block by 300 µM Ni2+ (red trace) in both groups. Experiments shown in the insets included 1 mM Cs+ in the bath. c The frequency and number of spikes in a rebound burst are highly correlated to the peak LVA current recorded in individual transient and weak burst cells. Burst frequencies are plotted as the increase above baseline tonic firing frequency. Modified from [7, 8]
Fig. 4
Fig. 4
Spike afterpotentials differ between transient burst and weak burst DCN neurons. a Representative superimposed spike traces from a transient burst cell (black trace) and weak burst cell (green trace) during tonic firing and rebound firing. Bar plots show the mean depth of the fAHP and sAHP of transient burst (white bars, n = 47) and weak burst cells (green bars, n = 62). b AHPs of transient and weak burst cells are differentially coupled to T-type and N-type Ca2+ channel influx. Representative traces showing the effects of Ni2+ (300 µM, blue traces) and ω-conotoxin GVIA (1 µM, red traces). Bar plots of the mean depth of AHPs in control and drug conditions for transient burst (n = 7 Ni2+; n = 8 Conotoxin) and weak burst cells (n = 10 Ni2+; n = 8 Conotoxin). c Spike DAPs are insensitive to Ca2+ and Na+ channel blockers. Shown are superimposed traces before and after applying the general Ca2+ channel blockers Ni2+ (1 mM) or Cd2+ (50 µM, gray traces). Insets show that current injection that simulates a spike response can generate a DAP in the presence of 200 nM TTX. Data presented in a and c were modified from [8]
Fig. 5
Fig. 5
Rebound bursts in transient and weak burst cells are evoked by inhibitory synaptic inputs. a Plots of the mean rebound frequency increase of transient (n = 16) and weak burst (n = 12) cells over a range of stimulus intensities (normalized to 100% of maximum) when recorded in on-cell mode. Dashed lines indicate that a subgroup of cells fail to exhibit rebound bursts at 20% of maximum intensity (number of samples indicated in brackets). b Bar plots of the maximum rebound burst frequencies in interpositus cells evoked by a ten-pulse, 100-Hz stimulus to Purkinje cell afferents to evoke a series of IPSPs at ∼60% maximum intensity. White bars show the response of transient or weak burst phenotypes first identified through direct current injection in whole cell recordings (bin width 20 Hz, n = 40) and red bars another population of cells recorded as single units in on-cell recording mode (n = 41). c Representative traces of transient and weak burst cells showing the effect of synaptic inhibitory stimulus trains when recorded first in on-cell mode (red traces) and following break-in to whole cell configuration (black traces). Stimulus artifacts are truncated. Plots of the corresponding instantaneous spike frequencies for these recordings are shown on the right (period of stimulation indicated by vertical gray bars). Plots were modified from [16]. Rebound frequencies shown in a and b represent increases beyond baseline tonic firing rates. The absolute membrane potentials at the trough of the AHP and during IPSPs are shown in c
Fig. 6
Fig. 6
Effects of Purkinje cell inhibitory synaptic input of transient and weak burst cells. a Comparison of single evoked IPSPs and associated IPSCs of representative transient and weak burst cells from a resting potential of −60 mV. Stimulus intensity was set to 60% of a maximal IPSC. Plots of the mean amplitude and rate of decay of the IPSC for transient (n = 10) and weak burst (n = 10) cells reveal no significant difference in the single evoked response. b IPSPs are finely graded in amplitude with the intensity of stimulation. Stimulus intensities were normalized to that which evoked a maximum IPSC in each cell and IPSP amplitude to the response at 20% maximum intensity. The response of several cells is shown superimposed. c Rebound burst intensity is affected by the number of presynaptic stimuli. Representative cells showing an increase in rebound intensity as the input is increased from 10 to 20 stimuli (100 Hz, 60% maximum intensity, p < 0.05). Stimulus artifacts are truncated in c. The absolute membrane potential at the trough of the AHP and during IPSP trains are shown in a and c. Data in a and b is modified from [16] and in c from our recordings published in DeShutter and Steuber [84]
Fig. 7
Fig. 7
Repetitive stimulation does not recruit metabotropic glutamate receptor depolarizations. a On the left is a schematic diagram of climbing fiber (CF) and mossy fiber (MF) afferents with excitatory collaterals to DCN cells of the interpositus nucleus (cresyl violet-stained sagittal slice). Numbers and arrows denote the point of stimulation in a slice. All recordings were performed in 50 µM picrotoxin. EPSPs were evoked from a stimulation site dorsal and outside of the nucleus (1) or from a site ventral and closer to recorded cells within the nucleus (2). b On the left are representative recordings from two different transient burst cells in response to ten-pulse, 100-Hz stimulus trains (horizontal gray bars) from the two stimulus sites. On the right plots of the mean spike frequency before and after stimulus trains (demarked by vertical gray bars) reveal no evidence for a rebound frequency increase either in control conditions or in the presence of the mGluR1 receptor blocker JNJ16259685 (50 nM, n = 12 transient, n = 11 weak burst)

Similar articles

Cited by

References

    1. Czubayko U, Sultan F, Thier P, Schwarz C. Two types of neurons in the rat cerebellar nuclei as distinguished by membrane potentials and intracellular fillings. J Neurophysiol. 2001;85(5):2017–2029. - PubMed
    1. Aizenman CD, Linden DJ. Regulation of the rebound depolarization and spontaneous firing patterns of deep nuclear neurons in slices of rat cerebellum. J Neurophysiol. 1999;82(4):1697–1709. - PubMed
    1. Uusisaari M, Obata K, Knopfel T. Morphological and electrophysiological properties of GABAergic and non-GABAergic cells in the deep cerebellar nuclei. J Neurophysiol. 2007;97(1):901–911. - PubMed
    1. Jahnsen H. Extracellular activation and membrane conductances of neurones in the guinea-pig deep cerebellar nuclei in vitro. J Physiol. 1986;372:149–168. - PMC - PubMed
    1. Raman IM, Gustafson AE, Padgett D. Ionic currents and spontaneous firing in neurons isolated from the cerebellar nuclei. J Neurosci. 2000;20(24):9004–9016. - PMC - PubMed

Publication types

Substances

LinkOut - more resources