

Real-life glycaemic profiles in non-diabetic individuals with low fasting glucose and normal HbA1c: the A1C-Derived Average Glucose (ADAG) study
- PMID: 20396998
- PMCID: PMC2892065
- DOI: 10.1007/s00125-010-1741-9
Real-life glycaemic profiles in non-diabetic individuals with low fasting glucose and normal HbA1c: the A1C-Derived Average Glucose (ADAG) study
Abstract
Aims/hypothesis: Real-life glycaemic profiles of healthy individuals are poorly studied. Our aim was to analyse to what extent individuals without diabetes exceed OGTT thresholds for impaired glucose tolerance (IGT) and diabetes.
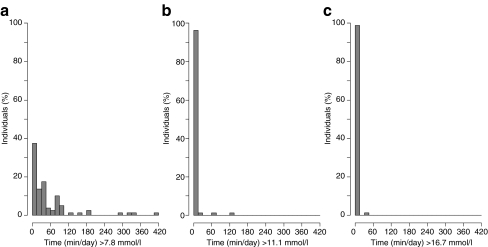
Methods: In the A1C-Derived Average Glucose (ADAG) study, 80 participants without diabetes completed an intensive glucose monitoring period of 12 weeks. From these data, we calculated the average 24 h glucose exposure as time spent above different plasma glucose thresholds. We also derived indices of postprandial glucose levels, glucose variability and HbA(1c).
Results: We found that 93% of participants reached glucose concentrations above the IGT threshold of 7.8 mmol/l and spent a median of 26 min/day above this level during continuous glucose monitoring. Eight individuals (10%) spent more than 2 h in the IGT range. They had higher HbA(1c), fasting plasma glucose (FPG), age and BMI than those who did not. Seven participants (9%) reached glucose concentrations above 11.1 mmol/l during monitoring.
Conclusions/interpretation: Even though the non-diabetic individuals monitored in the ADAG study were selected on the basis of a very low level of baseline FPG, 10% of these spent a considerable amount of time at glucose levels considered to be 'prediabetic' or indicating IGT. This highlights the fact that exposure to moderately elevated glucose levels remains under-appreciated when individuals are classified on the basis of isolated glucose measurements.
Figures
References
-
- World Health Organization (1999) Definition, diagnosis and classification of diabetes mellitus and its complications. Report of a WHO consultation, part 1: diagnosis and classification of diabetes mellitus. WHO, Geneva
Publication types
MeSH terms
Substances
Grants and funding
LinkOut - more resources
Full Text Sources
Medical
Miscellaneous
