. 2010 Apr;159(8):1646-62.
doi: 10.1111/j.1476-5381.2010.00659.x.

Obovatol attenuates microglia-mediated neuroinflammation by modulating redox regulation

Affiliations

Obovatol attenuates microglia-mediated neuroinflammation by modulating redox regulation

Jiyeon Ock et al. Br J Pharmacol. 2010 Apr.

Abstract

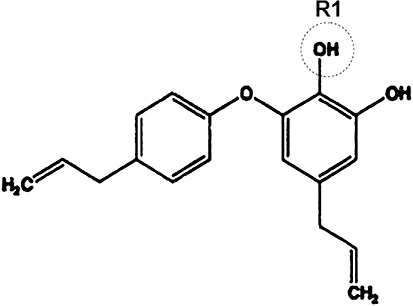
Background and purpose: Obovatol isolated from the medicinal herb Magnolia obovata exhibits a variety of biological activities. Here, the effect of obovatol and its mechanism of action on microglial activation, neuroinflammation and neurodegeneration were investigated.

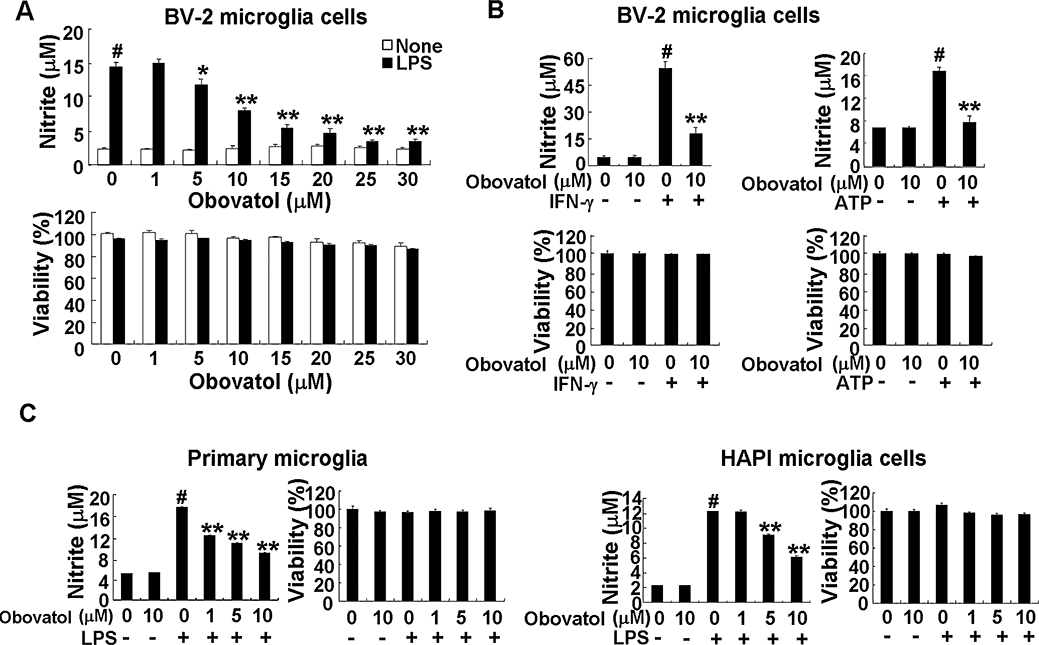
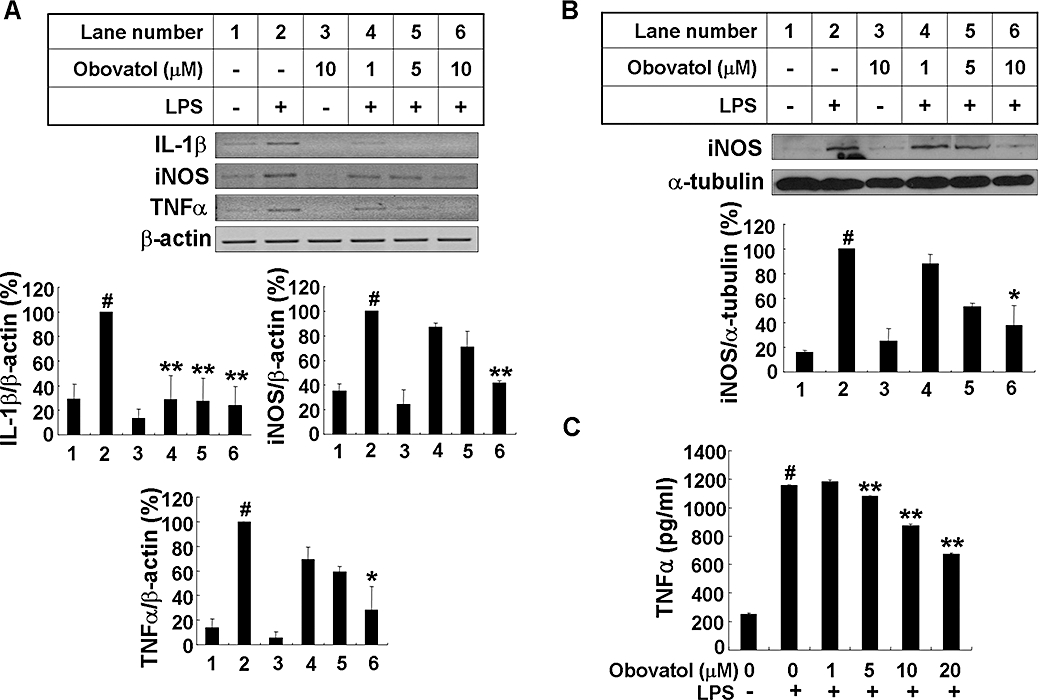
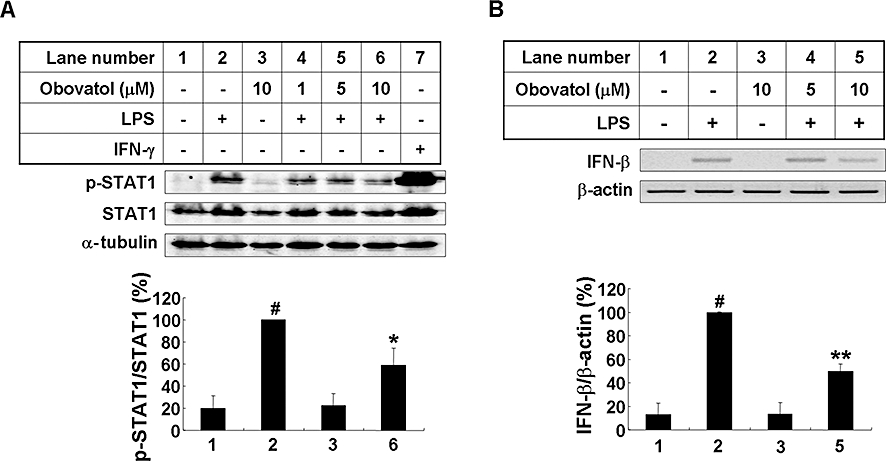
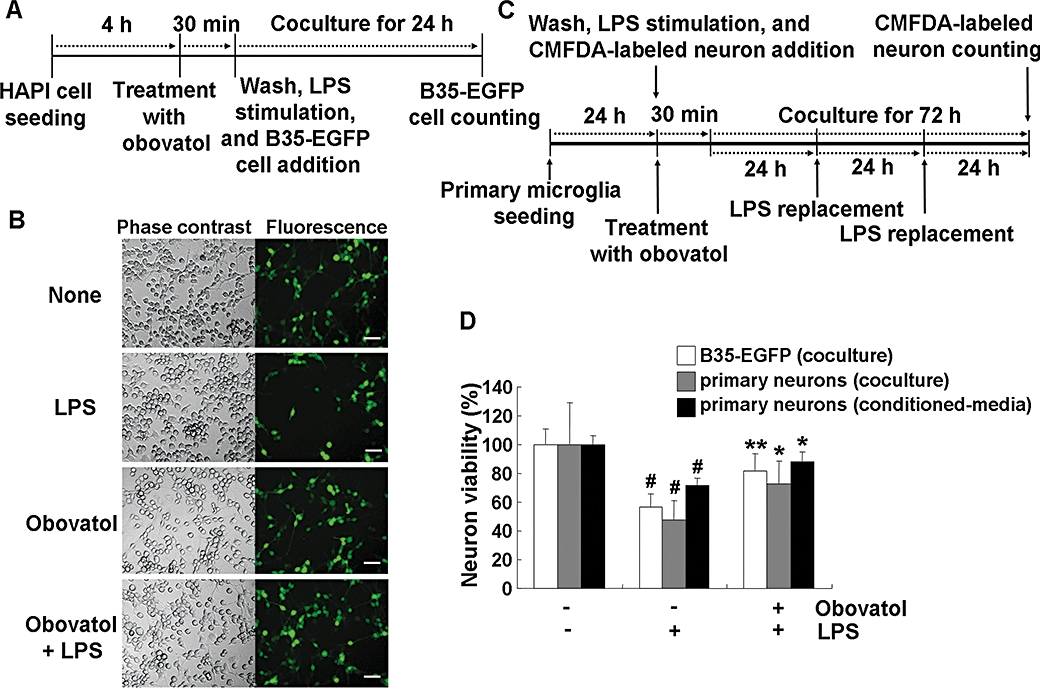
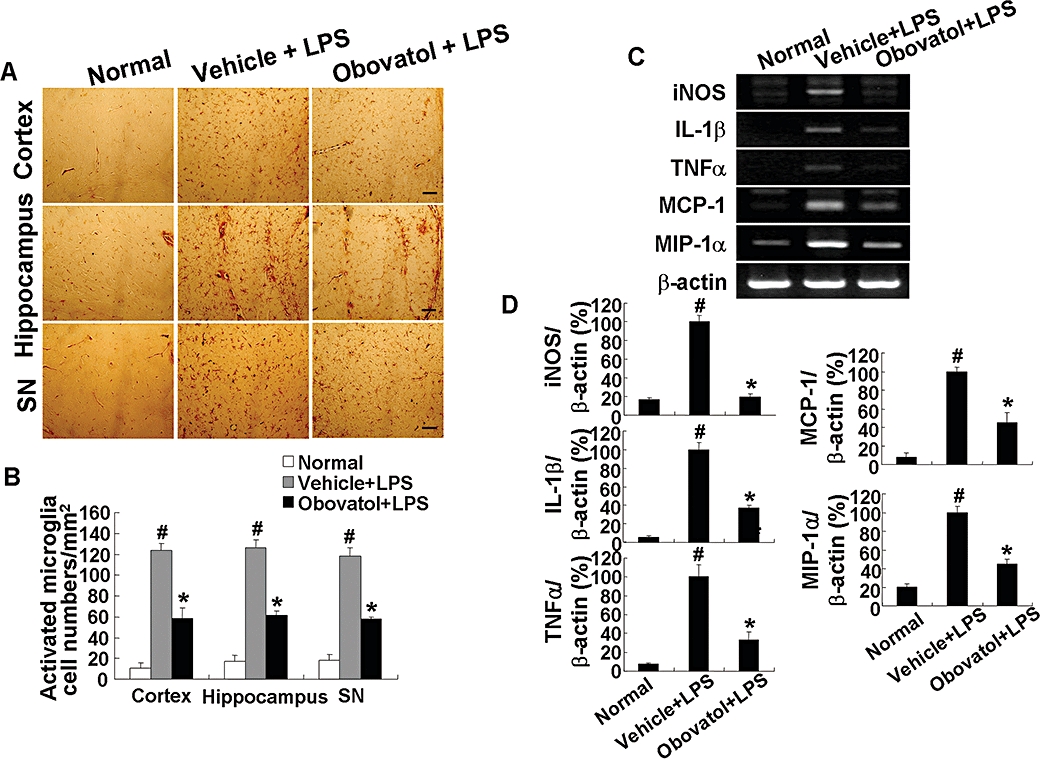
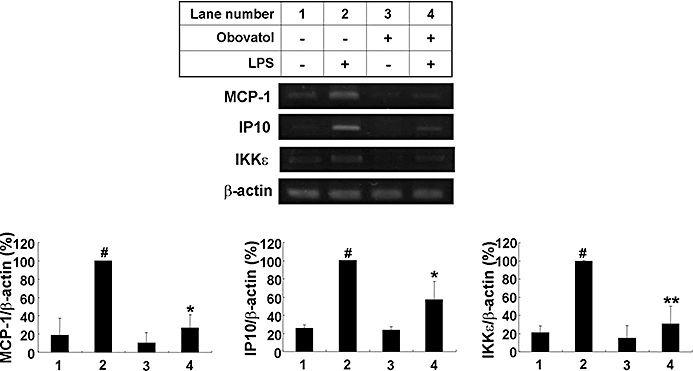
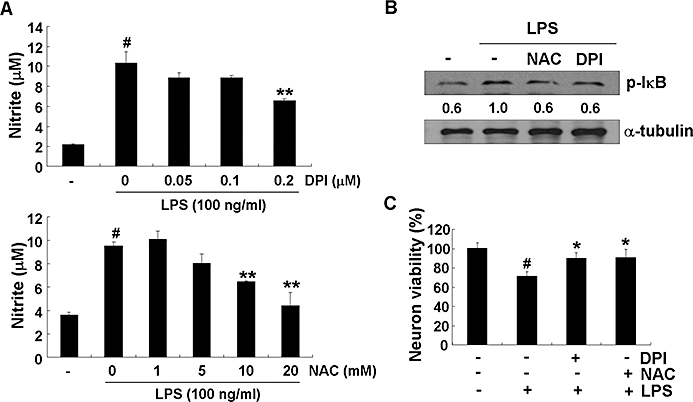
Experimental approach: In microglial BV-2 cells stimulated with lipopolysaccharide (LPS), we measured nitric oxide (NO) and cytokine production, and activation of intracellular signalling pathways by reverse transcription-polymerase chain reaction and Western blots. Cell death was assayed in co-cultures of activated microglia (with bacterial LPS) and neurons and in LPS- induced neuroinflammation in mice in vivo.

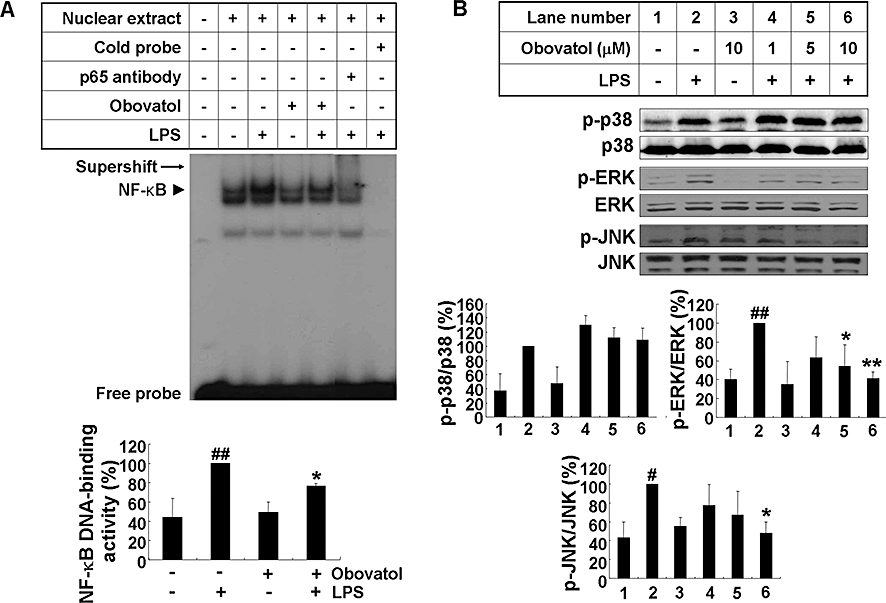
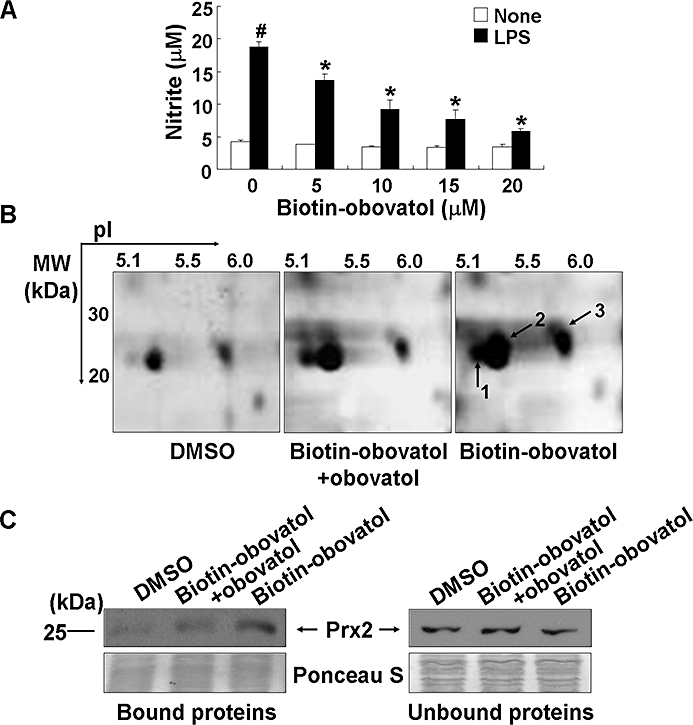
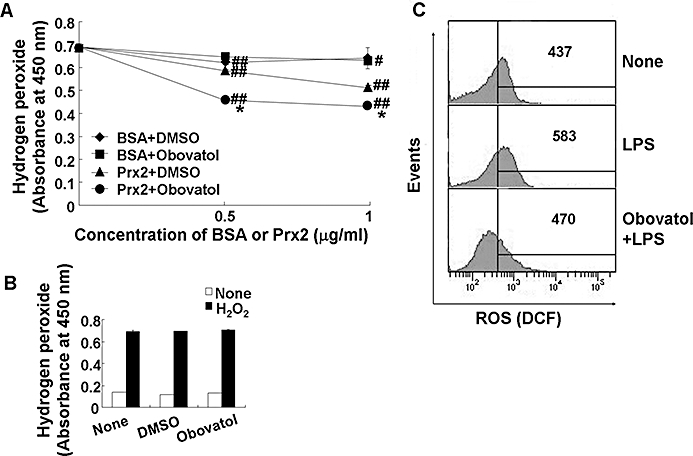
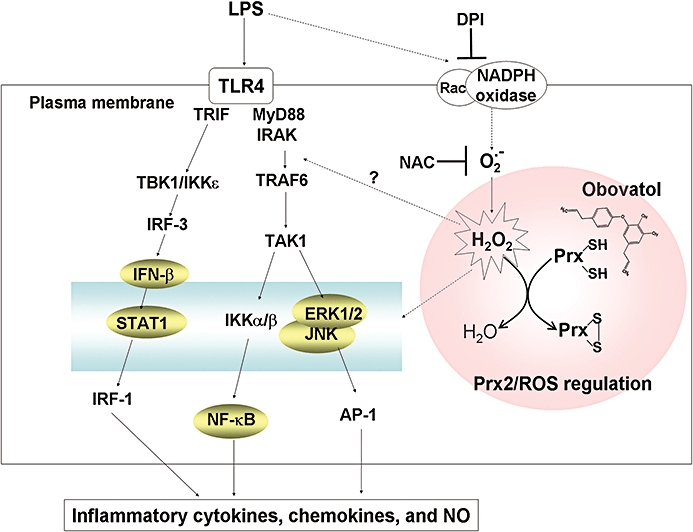
Key results: Obovatol inhibited microglial NO production with an IC50 value of 10 mM. Obovatol also inhibited microglial expression of proinflammatory cytokines and inducible nitric-oxide synthase, which was accompanied by the inhibition of multiple signalling pathways such as nuclear factor kappa B, signal transducers and activators of transcription 1, and mitogen-activated protein kinases. In addition, obovatol protected cultured neurons from microglial toxicity and inhibited neuroinflammation in mice in vivo. One molecular target of obovatol in microglia was peroxiredoxin 2 (Prx2), identified by affinity chromatography and mass spectrometry. Obovatol enhanced the reactive oxygen species (ROS)-scavenging activity of Prx2 in vitro, thereby suppressing proinflammatory signalling pathways of microglia where ROS plays an important role.

Conclusions and implications: Obovatol is not only a useful chemical tool that can be used to investigate microglial signalling, but also a promising drug candidate against neuroinflammatory diseases. Furthermore, our results indicate that Prx2 is a novel drug target that can be exploited for the therapeutic modulation of neuroinflammatory signalling.


Figures

Figure 1
Figure 1
The chemical structure of obovatol. The structure of obovatol is shown. The R1 (circle) indicates the position that was conjugated with biotin moiety.
Figure 2
Figure 2
Obovatol suppressed NO production in BV-2 microglia cells, primary microglia cultures or HAPI microglia cells. Microglia cells (either microglia cell lines or primary cultures as indicated) were treated with LPS (100 ng·mL−1) or ATP (2 mM) or IFN-γ (50 U·mL−1) in the absence or presence of indicated concentration of obovatol (A, 1–30 µM in BV-2 cells; B, 10 µM in BV-2 cells; C, 1-10 µM in primary microglia culture and HAPI rat microglia cells) for 24 h. Nitrite content was measured using the Griess reaction, and cytotoxicity of obovatol was assessed by MTT assays (A, B and C). The data were expressed as the mean ± SD (n= 3). #P < 0.01 versus untreated control; *P < 0.05, **P < 0.01 versus LPS, IFN-γ, or ATP alone. NO, nitric oxide; HAPI, highly aggressively proliferating immortalized; LPS, lipopolysaccharide; IFN, interferon.
Figure 3
Figure 3
Obovatol suppressed expression of iNOS, IL-1β, and TNFα in LPS-stimulated BV-2 microglia cells. BV-2 microglia cells were treated with LPS (100 ng·mL−1) in the absence or presence of 1–10 µM obovatol for 6 h (RT-PCR), 14 h (Western blot) or 24 h (TNFα ELISA). After treatment, total RNA was isolated and specific mRNA levels were determined by RT-PCR analysis (A; upper), and then subjected to densitometric quantification (A; lower). Levels of IL-1β, iNOS and TNFα were normalized to β-actin levels and expressed as a relative change in comparison with the LPS treatment, which was set to 100% (lane 2). Alternatively, BV-2 microglia cell lysates were subjected to Western blot for iNOS (B). Levels of iNOS were normalized α-tubulin levels and expressed as a relative change in comparison with the LPS treatment, which was set to 100% (lane 2). Lastly, culture media of BV-2 microglia cells were collected and subjected to TNFα sandwich ELISA (C). The data were expressed as the mean ± SD (n= 3), and are representative results obtained from three independent experiments. #P < 0.01 versus untreated control; *P < 0.05, **P < 0.01 versus LPS only. iNOS, inducible nitric oxide synthase; IL-1, interleukin 1; TNF, tumour necrosis factor; LPS, lipopolysaccharide; RT-PCR, reverse transcription-polymerase chain reaction.
Figure 4
Figure 4
Obovatol suppressed activation of NF-κB, ERK and JNK in LPS-stimulated microglia cells. BV-2 microglia cells were stimulated with 100 ng·mL−1 LPS in the absence or presence of obovatol (10 µM for EMSA, or 1–10 µM for MAPKs Western blot) that had been added 30 min before the activation. After LPS stimulation for 1 h, nuclear extracts were isolated for gel shift assay. LPS-induced NF-κB DNA binding activity was indicated by the arrow head. The supershift of NF-κB-specific band mobility in the gel using antibody against NF-κB confirmed the NF-κB binding specificity as indicated by arrow (A). Total lysates were obtained after 30 min activation with LPS, and phosphorylation of p38, ERK and JNK in the lysates was analysed by Western blotting (B). Levels of phospho-MAPKs were expressed as a relative change in comparison with the LPS treatment, which was set to 100% (lane 2). The data were expressed as the mean ± SD (n= 3). #P < 0.05, ##P < 0.01 versus untreated control; *P < 0.05, **P < 0.01 versus LPS only. NF-κB, nuclear factor κB; ERK, extracellular signal-regulated kinases; JNK, c-jun N-terminal kinase; LPS, lipopolysaccharide; EMSA, electrophoretic mobility shift assay; MAPK, mitogen-activated protein kinase.
Figure 5
Figure 5
Obovatol suppressed phosphorylation of STAT-1 and mRNA expression of IFN-β in LPS-stimulated microglia cells. BV-2 microglia cells were stimulated with 100 ng·mL−1 LPS in the absence or presence of 1–10 µM obovatol for 4 h. Total lysates were obtained and phosphorylation of STAT-1 in the cellular lysates were analysed by Western blotting. Levels of phospho-STAT1 were normalized to total-STAT1 levels, and expressed as a relative change in comparison with the LPS treatment, which was set to 100% (lane 2) (A). IFN-γ stimulation was used as a control. Alternatively, BV-2 microglia cells were stimulated with 100 ng·mL−1 LPS in the absence or presence of 5–10 µM obovatol for 2 h. Total RNA was isolated and subjected to RT-PCR analysis (B; upper), and then subjected to densitometric quantification (B; lower). Levels of IFN-β was normalized to β-actin levels and expressed as a relative change compared with the LPS treatment, which was set to 100% (lane 2). The data were expressed as the mean ± SD (n= 3). #P < 0.01 versus untreated control; *P < 0.05, **P < 0.01 versus LPS only. STAT1, signal transducers and activators of transcription 1; IFN, interferon; LPS, lipopolysaccharide; RT-PCR, reverse transcription-polymerase chain reaction.
Figure 6
Figure 6
Obovatol suppressed microglial neurotoxicity. HAPI rat microglia cells were pretreated with 10 µM of obovatol for 30 min and washed with PBS. Then, LPS (100 ng·mL−1) and B35-EGFP rat neuroblastoma cells were added to microglia cells for the co-culture for 24 h (A). At the end of co-culture, the number of viable B35-EGFP neuroblastoma cells in the five randomly chosen microscopic fields per well was counted under a fluorescence microscope (D; white bars). Representative fluorescence or phase contrast images of cells are shown (B). Scale bar, 50 µm. Obovatol alone did not exert cytotoxicity against B35-EGFP neuroblastoma cells (data not shown). For the co-culture of primary microglia and primary neurons, microglia were pretreated with 10 µM of obovatol for 30 min. Then, LPS (100 ng·mL−1) and CMFDA-labelled primary neurons were added to microglia cultures. The culture media were replaced with fresh media containing LPS every 24 h, over 72 h (C). After LPS stimulation for 72 h, CMFDA-positive neurons were counted under a fluorescence microscope (D). For the preparation of primary microglia-conditioned media, microglia cultures were treated with LPS (100 ng·mL−1) in the absence or presence of 10 µM obovatol for 6 h. Culture media were removed, and fresh culture media were then added to microglia culture. After additional 24 h incubation, conditioned media were collected and added to primary neurons. After 24 h incubation, the viability of neurons was assessed by MTT assay (D). Results were expressed as a percentage of control (unstimulated microglia cultures+neuroblastoma or neurons) (mean ± SD; n= 3). #P < 0.01 versus control; *P < 0.05, **P < 0.01 versus LPS only. HAPI, highly aggressively proliferating immortalized; PBS, phosphate-buffered saline; LPS, lipopolysaccharide; EGFP, enhanced green fluorescent protein; CMFDA, 5-chloromethylfluorescein diacetate.
Figure 7
Figure 7
Obovatol suppressed microglial activation in a mouse neuroinflammation model. C57BL/6 mice were injected i.p. with vehicle (saline containing 0.5% DMSO and 5% propylene glycol) or obovatol (diluted in saline containing 5% propylene glycol) once daily at 10 mg·kg−1 for 4 days. At 24 h after the first injection of vehicle or obovatol, mice were injected i.p.with 5 mg·kg−1 LPS. Mice were anesthetized with diethyl ether and transcardially perfused with ice-cold saline 72 h after the LPS injection. Brains were removed and sections were stained with IB4 (a marker for microglia). IB4-positive cells were observed in cortex, hippocampus, and substantia nigra (SN) region of vehicle+LPS- or obovatol+LPS-injected mouse brains (A). Scale bar, 50 µm. The number of IB4-stained cell per mm2 was counted (B). The expression levels of proinflammatory genes were determined by RT-PCR at 6 h after the LPS injection (C). Levels of iNOS, IL-1β, TNFα, MCP-1 and MIP-1α were normalized to β-actin levels and expressed as a relative change in comparison with the LPS treatment, which was set to 100% (D). The data were expressed as the mean ± SD (n= 3 per experimental group). #P < 0.01 versus normal animals; *P < 0.01 versus vehicle+LPS-injected animals. DMSO, dimethyl sulfoxide; LPS, lipopolysaccharide; RT-PCR, reverse transcription-polymerase chain reaction; iNOS, inducible nitric oxide synthase; IL-1, interleukin 1; TNF, tumour necrosis factor; MCP, monocyte chemotactic protein; MIP, macrophage inflammatory protein.
Figure 8
Figure 8
Re-evaluation of microarray-based differential gene expression by RT-PCR. BV-2 microglia cells were stimulated with 100 ng·mL−1 LPS in the absence or presence of 10 µM obovatol for 6 h. After treatment, total RNA was isolated and subjected to DNA microarray analysis. The expression of MCP-1, IP10 and IKKε genes was assessed by RT-PCR (upper). Levels of MCP-1, IP10 and IKKε were normalized to β-actin levels and expressed as a relative change in comparison with the LPS treatment, which was set to 100% (lane 2) (lower). The data were expressed as the mean ± SD (n= 3). #P < 0.01 versus untreated control; *P < 0.05, **P < 0.01 versus LPS only. RT-PCR, reverse transcription-polymerase chain reaction; LPS, lipopolysaccharide; MCP, monocyte chemotactic protein; IP10, interferon-inducible protein 10; IKK, inhibitor of kappaB kinase.
Figure 9
Figure 9
Affinity purification of obovatol-binding protein(s). BV-2 microglia cells were stimulated with 100 ng·mL−1 LPS in the absence or presence of 5–20 µM biotin-obovatol. After 24 h, the amount of nitrite in the culture media was evaluated using Griess reaction (A). The data were expressed as the mean ± SD (n= 3). #P < 0.01 versus untreated control; *P < 0.01 versus LPS only. BV-2 microglia cell lysates were incubated with DMSO, mixture of biotin-obovatol (20 µM) and obovatol (20 µM), or biotin-obovatol (20 µM), which were then applied to a column with avidin beads. The proteins were eluted and subjected to 2-DE analysis followed by silver-staining. The gel image represents the eluted proteins from the column containing DMSO, biotin-obovatol+obovatol or biotin-obovatol (B). Several protein spots, which showed differential intensity in 2-DE gel, were identified as Prx2 (spots 1 and 2) and Prx1 (spot 3). Eluted proteins (bound) and flow-through proteins (unbound) from the each affinity column were analysed by immunoblot for Prx2 (C). DMSO, dimethyl sulfoxide; LPS, lipopolysaccharide; Prx2, peroxiredoxin 2.
Figure 10
Figure 10
Obovatol enhanced the peroxidase activity of Prx2 and suppressed intracellular ROS production. Ferrous oxidation assay was carried out in 100 µL of reaction mixture containing DTT (2 mM), H2O2 (50 µM), obovatol (10 µM) and recombinant Prx2 protein. After incubation of the mixture for 10 min, the remaining H2O2 was measured based on the color changes after adding Fe(NH4)SO4 and potassium thiocyanate. DMSO and BSA were used as a vehicle control for obovatol and a negative control for Prx2 respectively. The data were expressed as the mean ± SD (n= 3). #P < 0.05, ##P < 0.01 versus H2O2 only; *P < 0.01 versus BSA+DMSO or Prx2+DMSO (A). The direct H2O2-scavenging effect of obovatol was also evaluated by ferrous oxidation assay in the absence of recombinant Prx2 protein (B). BV-2 microglia cells were treated with 100 ng·mL−1 LPS for 30 min in the absence or presence of obovatol (10 µM), followed by 30 min incubation with 10 µM H2DCF-DA. Fluorescence was measured by flow cytometer. The results were expressed as the mean fluorescence intensity (C). DMSO, dimethyl sulfoxide; Prx2, peroxiredoxin 2; ROS, reactive oxygen species; DTT, dithiothreitol; BSA, bovine serum albumin.
Figure 11
Figure 11
NADPH oxidase mediated LPS-induced microglial activation. BV-2 microglia cells were treated with DPI or NAC for 30 min before the addition of LPS (100 ng·mL−1). After 24 h, the nitrite in the media was measured by Griess reaction (A). After 30 min activation with LPS (100 ng·mL−1), the cells were harvested and analysed by immunoblot for phospho-IκB. Levels of phospho-IκB were normalized to α-tubulin levels and expressed as a fold decrease compared with the LPS treatment (B). Primary microglia were stimulated with LPS (100 ng·mL−1) in the absence or presence of DPI or NAC for 6 h, culture media were replaced with fresh media and further incubated for 24 h. The microglia-conditioned media were collected and transferred to primary neurons followed by additional 24 h incubation. At the end of incubation, cell viability was determined by MTT. Results were expressed as a percentage of control (mean ± SD) (C). The data were expressed as the mean ± SD (n= 3). #P < 0.01 versus untreated control; *P < 0.05, **P < 0.01 versus LPS only. LPS, lipopolysaccharide; DPI, diphenyliodonium; NAC, N-acetyl cysteine.
Figure 12
Figure 12
Possible mechanism(s) by which obovatol inhibits microglial inflammatory signalling through targeting Prx2. LPS initiates NADPH oxidase activation and ROS (H2O2) production. H2O2 is believed to modulate phosphorylation of the key signalling proteins in TLR4 signalling. H2O2 may also participate in the activation of NF-κB, MAPK and STAT pathways, which lead to the release of proinflammatory cytokines, chemokines and NO. Prx2 (reduced form) reduces H2O2 through the formation of disulfide bond (oxidized form), thereby suppressing the proinflammatory LPS/TLR4 signalling. Obovatol binds to Prx2 and enhances its peroxidase activity, ultimately down-regulating the LPS/TLR4 signalling. The signalling components on which the effect of obovatol was determined in this study are indicated by shaded circles. Dotted lines represent incompletely defined pathways. Prx2, peroxiredoxin 2; LPS, lipopolysaccharide; ROS, reactive oxygen species; NF-κB, nuclear factor κB; MAPK, mitogen-activated protein kinase; STAT, signal transducers and activators of transcription; NO, nitric oxide; TLR4, Toll-like receptor 4.

Similar articles

Cited by

References

    1. Alexander SPH, Mathie A, Peters JA. Guide to Receptors and Channels (GRAC), 4th edn. Br J Pharmacol. 2009;158(Suppl 1):S1–S254. - PMC - PubMed
    1. Araki W, Yuasa K, Takeda S, Shirotani K, Takahashi K, Tabira T. Overexpression of presenilin-2 enhances apoptotic death of cultured cortical neurons. Ann N Y Acad Sci. 2000;920:241–244. - PubMed
    1. Asehnoune K, Strassheim D, Mitra S, Kim JY, Abraham E. Involvement of reactive oxygen species in Toll-like receptor 4-dependent activation of NF-kappa B. J Immunol. 2004;172:2522–2529. - PubMed
    1. Bhat NR, Zhang P, Lee JC, Hogan EL. Extracellular signal-regulated kinase and p38 subgroups of mitogen-activated protein kinases regulate inducible nitric oxide synthase and tumor necrosis factor-alpha gene expression in endotoxin-stimulated primary glial cultures. J Neurosci. 1998;18:1633–1641. - PMC - PubMed
    1. Blasi E, Barluzzi R, Bocchini V, Mazzolla R, Bistoni F. Immortalization of murine microglial cells by a v-raf/v-myc carrying retrovirus. J Neuroimmunol. 1990;27:229–237. - PubMed

Publication types

MeSH terms