

Review
doi: 10.1021/cr900284a.
Alternatives to gadolinium-based metal chelates for magnetic resonance imaging
Affiliations
- PMID: 20397688
- PMCID: PMC2874212
- DOI: 10.1021/cr900284a
Item in Clipboard
Review
Alternatives to gadolinium-based metal chelates for magnetic resonance imaging
Chem Rev.
.
No abstract available
Figures
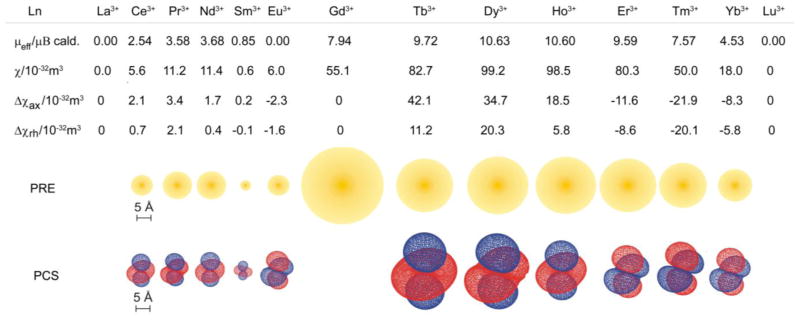
Paramagnetic properties of the lanthanides. μeff is the calculated magnetic moment calculated based on the ground term, μB is the Bohr magneton, χ is the magnetic susceptibility tensor, Δχax and Δχrh are the axial and rhombic components of χ. PRE is the paramagnetic relaxation enhancement and the radius of the yellow sphere indicates the distance at which 1H NMR signals experience significant line broadening. PCS is the pseudo contact shift and the isosurfaces represent the sign and magnitude of the lanthanide induced pseudocontact shift for each ion. Note, that Eu3+ would theoretically be diamagnetic according to its 7F0 ground state, but its magnetic properties are also influenced by contributions from the low lying, thermally accessible 7F1 and 7F2 levels giving rise to a magnetic moment of around 3.5 μB. Reproduced with permission from reference 21. Copyright 2007 American Chemical Society.
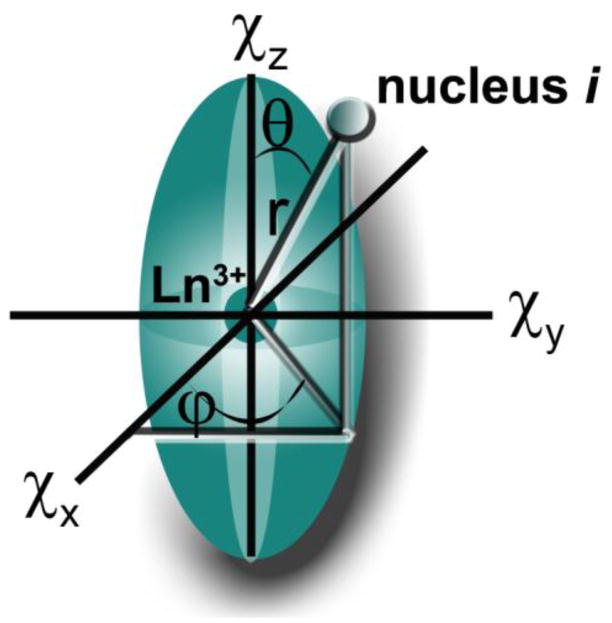
A schematic representation of the anisotropy of the lanthanide induced pseudocontact shift.
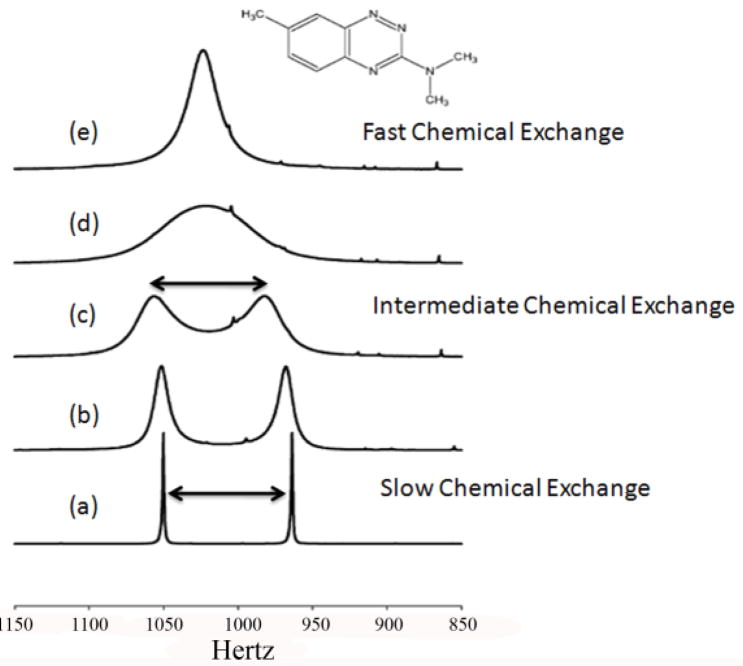
Proton NMR spectra at 300 MHz of the N-methyl signals in a derivative of azapropazone as a function of temperature. The bottom spectrum was recorded at 223 K while the others were recorded at 243, 243, 263 and 273, respectively. Reprinted from reference 53, Copyright (2003), with permission from Elsevier.
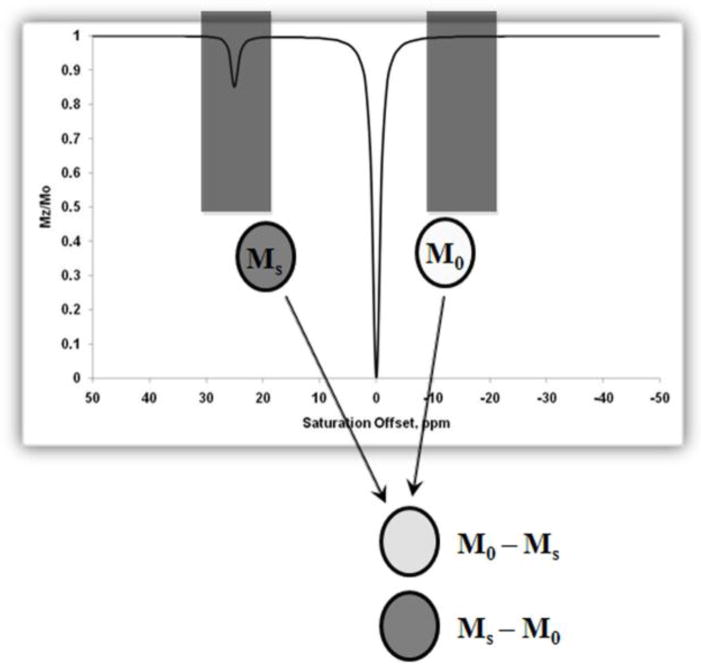
Simulated Z-spectrum for a two-pool exchange system with pool A (bulk water) at zero and pool B (solute protons) at 25 ppm. Values for simulation include a presaturation pulse of 250 Hz with irradiation time of 3 s. The peak at 0 ppm shows the net decrease in magnetization (
) of bulk water upon direct saturation, while the peak at 25 ppm shows the net decrease in magnetization of the bulk water upon saturation of the pool B protons. This figure also provides a schematic illustration of the procedure used to obtain a CEST image.
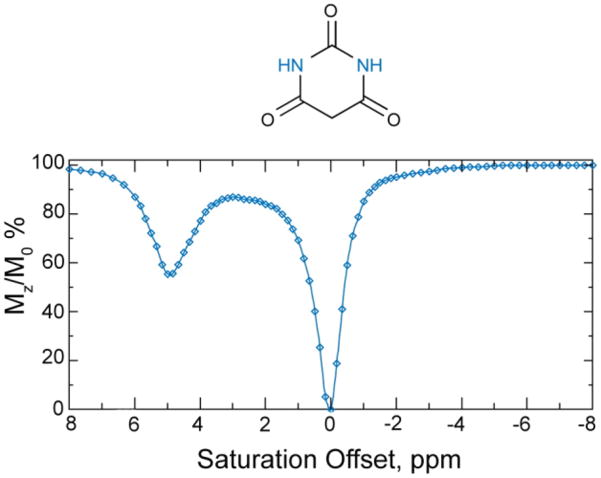
CEST Spectrum of an aqueous solution of barbituric acid. Reproduced, with permission, from the Annual Review of Biomedical Engineering, Volume 10 © 2008 by Annual Reviews www.annualreviews.org .
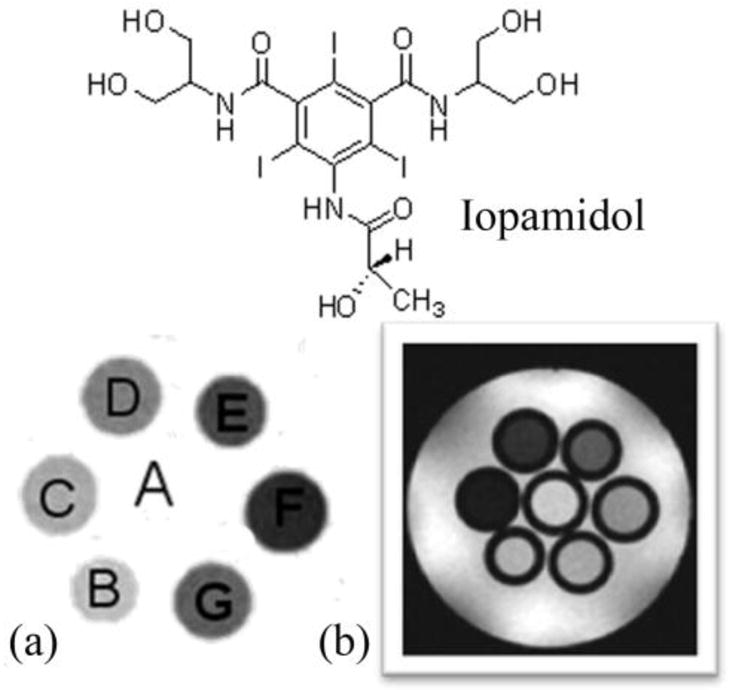
A comparison between the T2-weighted MR image (b) and a CEST MRI difference image (a) of the same phantom. The phantoms A-G contain different concentrations of iopamidol in solution, A: Water, B: 13 mM, C: 26 mM, D: 65 mM, E: 130 mM, F: 260 mM, G: 520 mM. CEST MR imaging conditions (Ms-M0, 7.05 T, pH 7.4 and 310 K): irradiation power = 12.4 μT, irradiation time = 7 s. Reference . Copyright (2000); Reprinted with permission of John Wiley & Sons, Inc.
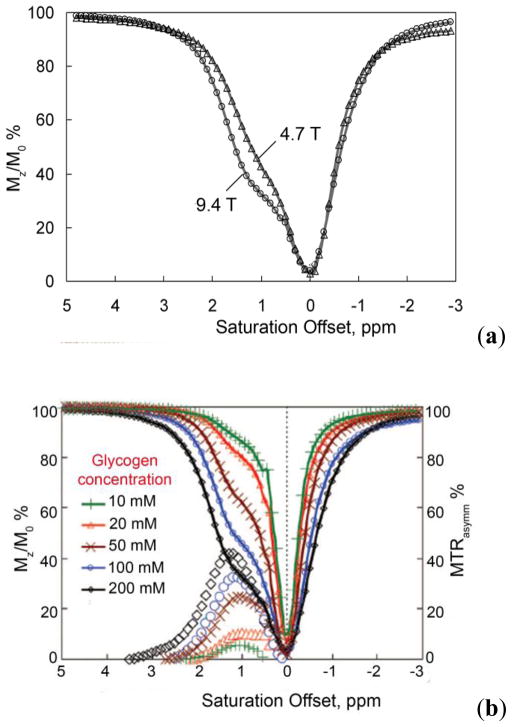
(a) CEST spectra of 200 mM glycogen in PBS buffer at 310 K acquired at both 9.4 T and 4.7 T. (b) CEST spectra and asymmetryplots of glycogen at varying concentrations acquired at 9.4 T in PBS at 310 K and pH = 7.4. CEST spectroscopy conditions: irradiation time = 10 s, irradiation power = 1.9 μT. Copyright (2007) National Academy of Sciences, U.S.A.
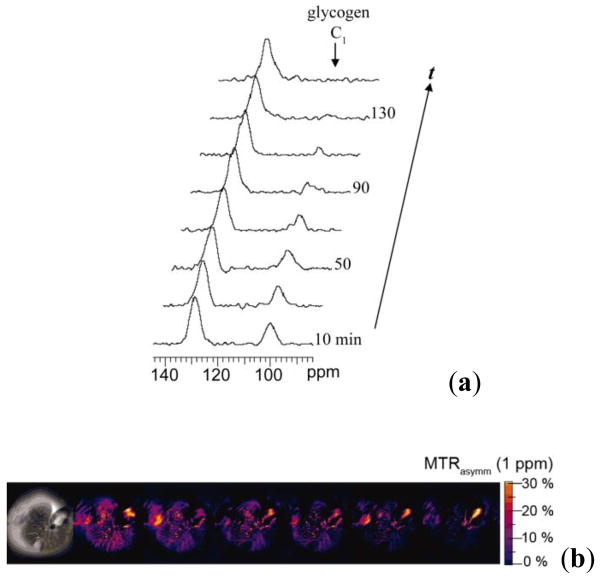
(a) 13C NMR spectra of a liver from a fed mouse showing the disappearance of glycogen after glucagon administration. The resonance at 100 ppm is distinctive of the C1 carbon of glycogen with the 130 ppm resonance being from unsaturated fats in liver (used in this study as an internal standard only). (b) Colorized glycoCEST images of a perfused fed-mouse liver at 4.7 T and 310 K. The colorized CEST images as a function of time show the relative CEST intensity of liver tissue as a function of perfusion time. Copyright (2007) National Academy of Sciences, U.S.A.
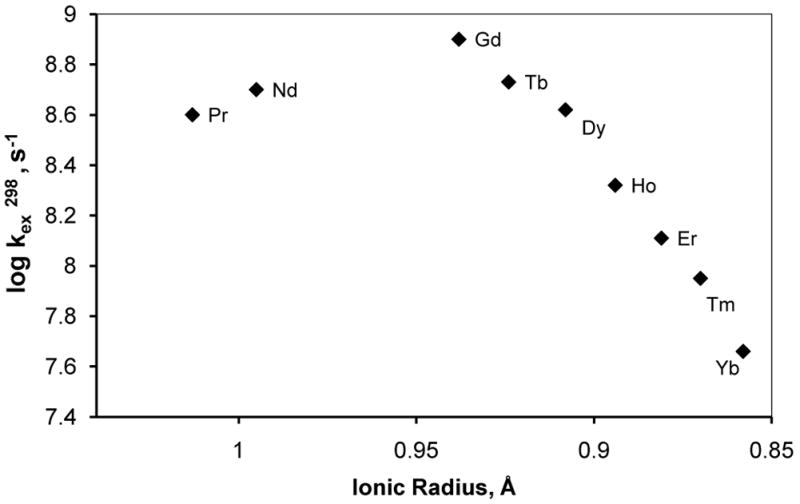
Dependence of the water exchange rate of lanthanide aqua ions on the ionic radius. The values for Pr3+ and Nd3+ represent the lower limit of kex. Adapted with permission from reference , Copyright 2005 American Chemical Society.
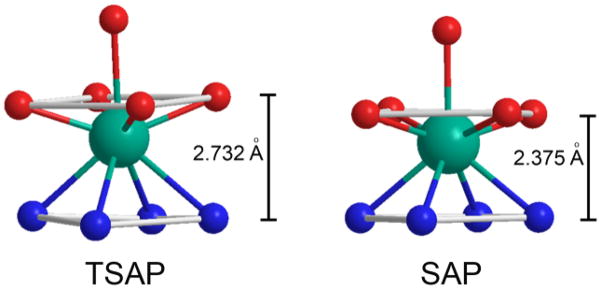
Schematic representation of the SAP and TSAP coordination geometries showing only the atoms directly coordinating to the central lanthanide metal ion.
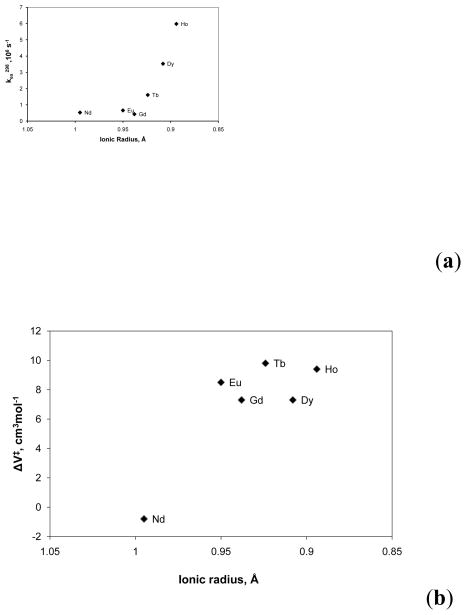
(a) Dependence of the metal-bound water exchange rate of Ln3+-15 complexes on the ionic radius. (b) Dependence of the activation volume for the metal-bound water exchange of Ln3+-15 on the ionic radius. Adapted with permission from reference , Copyright 1995 American Chemical Society.
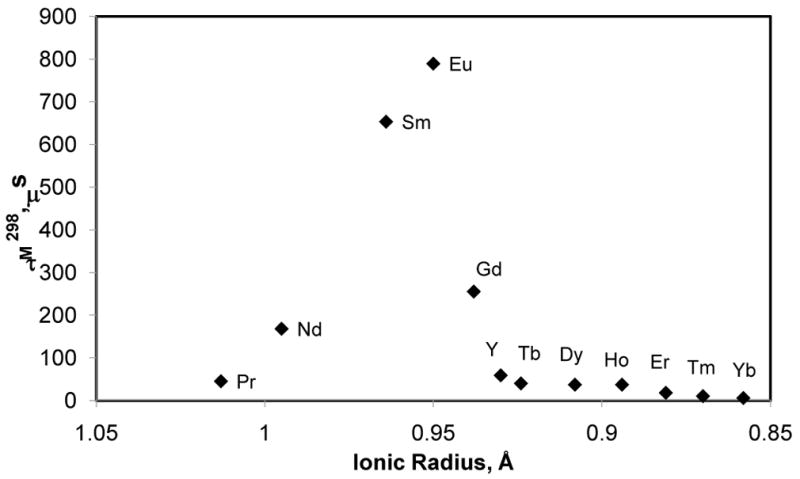
Dependence of the metal-bound water residence lifetime of Ln3+-16 on the ionic radius. Adapted with permission from reference , Copyright 2002 American Chemical Society.
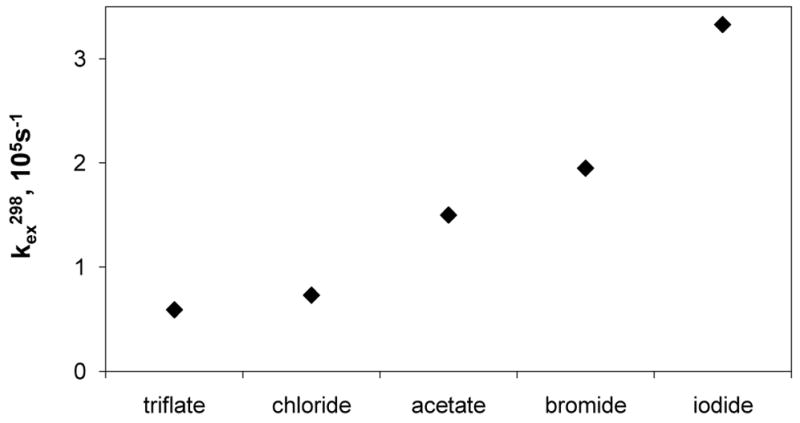
Dependence of the metal-bound water exchange rate of Gd3+-17 on the counter ion. Reference - Adapted with permission of the Royal Society of Chemistry.
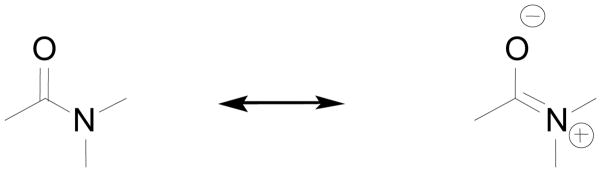
The resonance structure of the amide functional group.
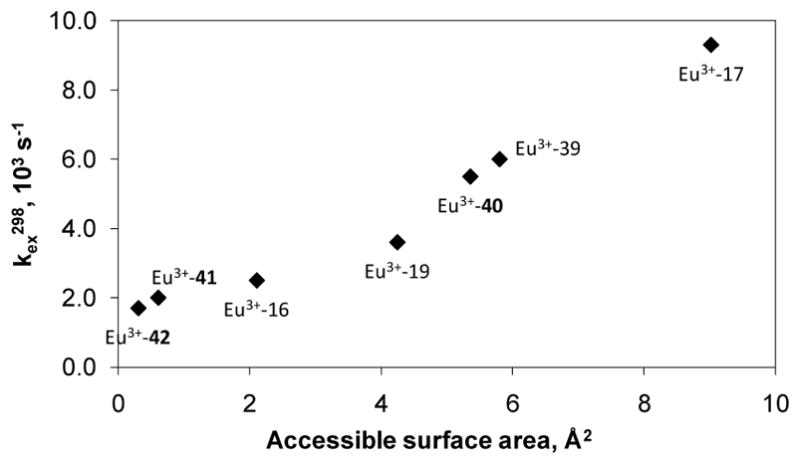
Dependence of the metal-bound water exchange rate on the accessible surface area. Reference - Adapted with permission of the Royal Society of Chemistry.
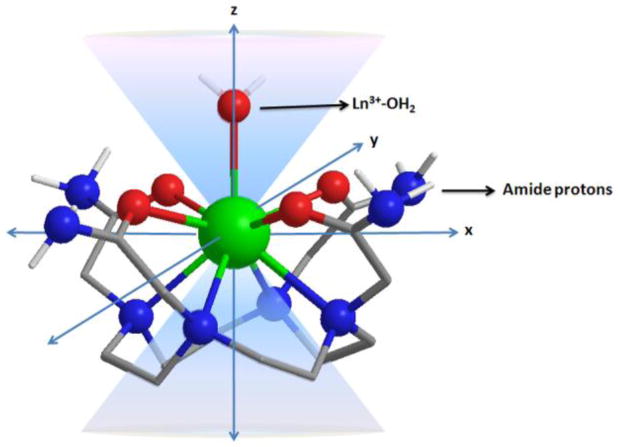
Illustration of the lanthanide induced shift on the lanthanide bound water protons and the amide protons. The lanthanide bound water molecule aligned along the principle z axis experiences the largest hyperfine shift, while the amide protons are oriented such that they do not experience the dipolar magnetic field of the lanthanide ion. The dipolar field of the Ln3+ ion is indicated by the blue cone.
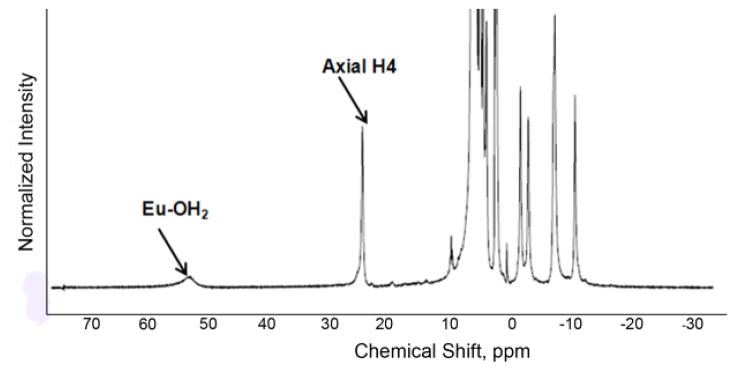
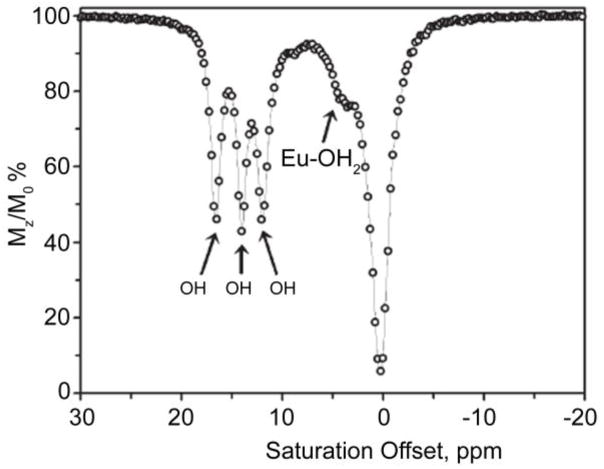
High Resolution 1H NMR spectrum of an aqueous solution of Eu3+-16 at 400 MHz at 20°C.
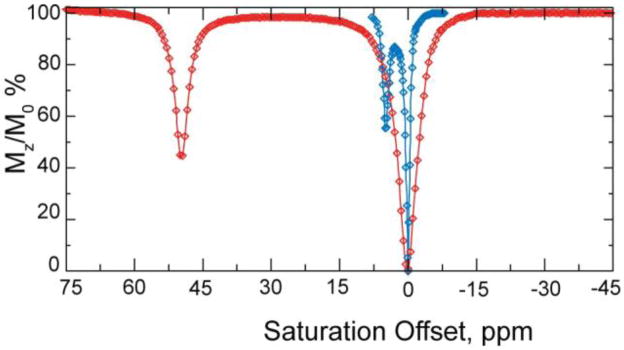
The CEST spectrum of barbituric acid (blue) is shown in the same scale as that of Eu3+-16 (red) for comparison. Reproduced, with permission, from the Annual Review of Biomedical Engineering, Volume 10 © 2008 by Annual Reviews www.annualreviews.org .
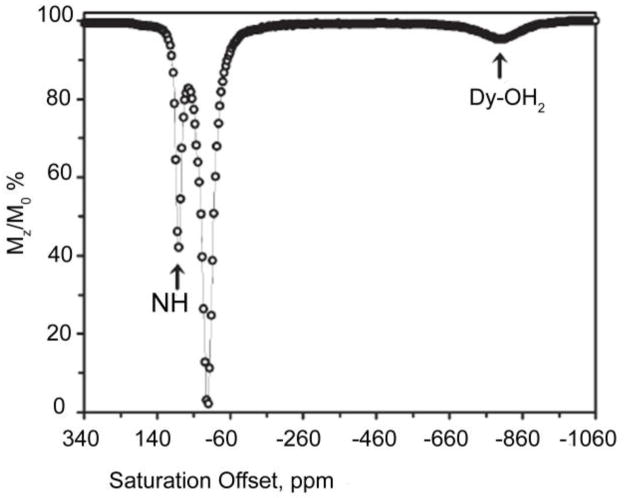
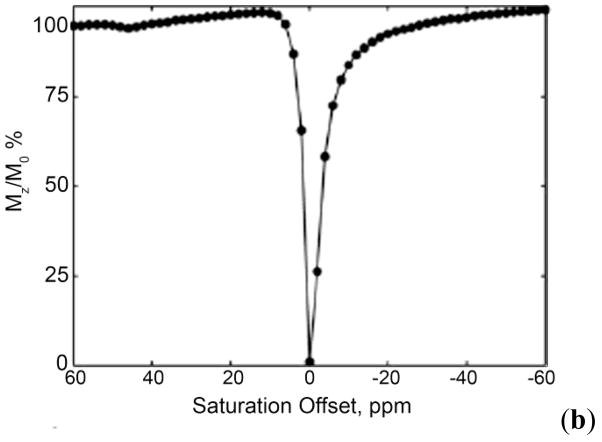
The CEST spectrum of Dy3+-17 recorded at 400 MHz and 298 K. The peak at +80 ppm represents amide proton exchange while the peak at −720 ppm reflects exchange of the bound water molecule in the complex. Reference - Reproduced by permission of the Royal Society of Chemistry.
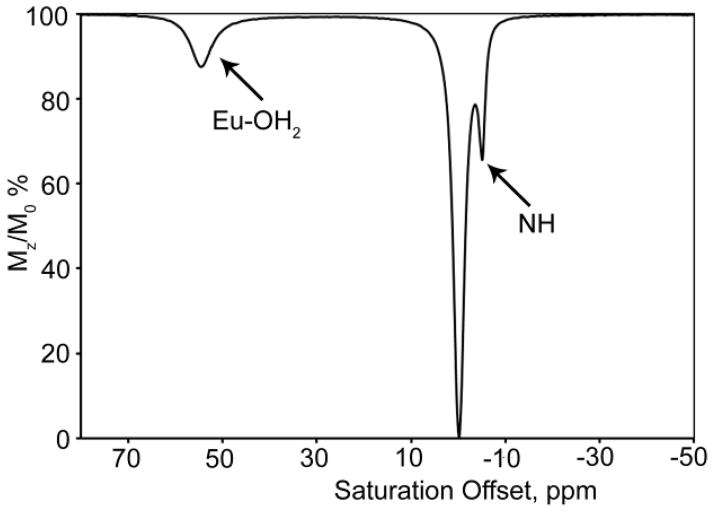
CEST spectrum of a 20 mM aqueous solution of Eu3+-51 at 298 K and pH 7.0 with CEST responses from bound water (55 ppm) and –NH protons (−5 ppm).
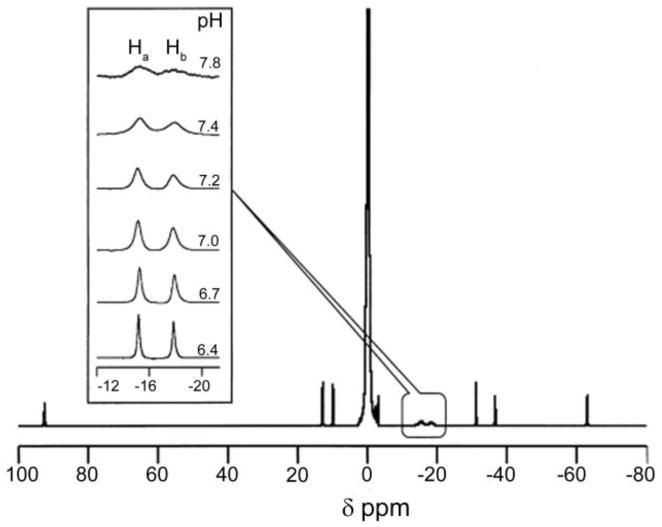
High resolution 1H NMR spectrum of a 30 mM aqueous solution of Yb 3+-17 recorded at 500 MHz, pH 7.4 and 298 K. The inset shows the signals of the two amide protons as a function of pH. Reference . Copyright (2002); Reprinted with permission of John Wiley & Sons, Inc.
CEST spectrum of a 36 mM solution of Eu3+-53 recorded in CD3CN. CEST spectroscopy conditions (270 MHz and 296 K): irradiation time = 2s, irradiation power = 0.64 μT. Reproduced with permission from reference . Copyright 2006 American Chemical Society.
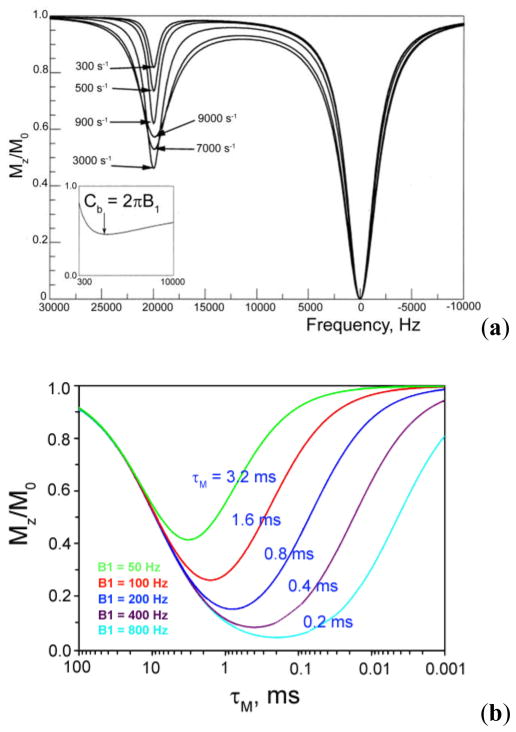
(a) Simulated CEST spectra for a two-site exchange system showing the effects of different exchange rates for a given value of B1 on the residual magnetization of the bulk water. The inset shows a plot of the residual magnetization (
) vs exchange rate, varying from 300 s-1 to 10000 s-1. Maximum CEST effect is observed when the exchange rate (1/τb) is equal to 2πB1. Reference . Copyright (2005); Reprinted with permission of John Wiley & Sons, Inc. (b) Changes in the CEST effects (
) of a PARACEST agent as a function of the residence lifetime of the exchanging protons in the PARACEST agent. Reference – Reproduced by permission of the Royal Society of Chemistry.
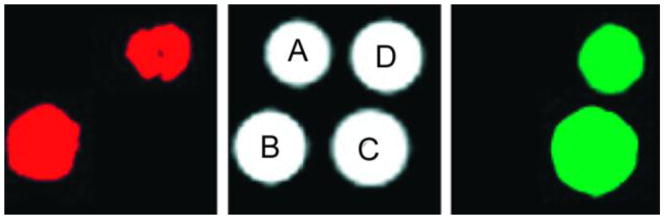
MRI phantom images acquired at 7.05 T in PBS buffer of four capillaries that contain: (A) PBS Buffer, (B) Tb3+-51 (2 mM), (C) Eu3+-51 (2 mM), (D) Tb3+-51 and Eu3+-51 (1 mM each). Left Image: CEST MR Difference image obtained by irradiation of the metal bound water protons of the Tb3+ complex at -600 ppm. Right Image: CEST MR Difference image obtained by irradiation of the Eu3+ complex at +50 ppm. The red and green colors are assigned arbitrarily. CEST MR imaging conditions: train of sinc 3 pulses (1 ms for Eu3+ and 250 μs for Tb3+), inter-pulse delay = 10 μs, irradiation power = 250 μT, irradiation time = 2s. Reference , Copyright 2005; Reprinted with permission of John Wiley & Sons, Inc.
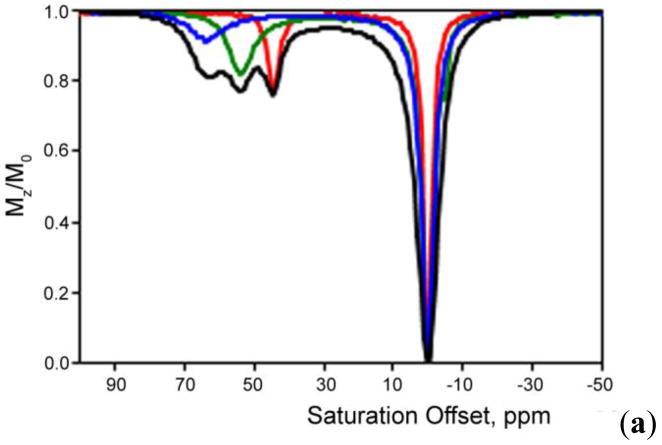
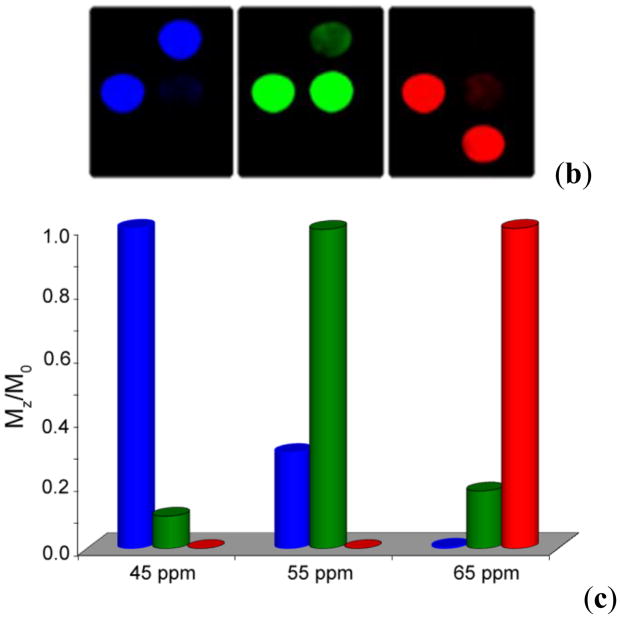
(a) Combined PARACEST spectra due to bound water protons at 45 ppm (20 mM), 54 ppm (15 mM) and 64 ppm (11 mM) for Eu 3+-54 (Red), Eu3+-55 (Green) and Eu3+-56 (Blue) respectively The black trace indicates a cocktail of the three complexes (20 mM). CEST spectroscopy conditions (recorded at 400 MHz, 298 K, pH = 7.0): irradiation power = 5 μT and irradiation time = 5 s. (b) Colored images of the three complexes and the cocktail: water (Dark Region), 44 (Red), 45 (Green), and 46 (Blue). CEST MR imaging conditions (recorded at 4.7 T, 298 K, pH = 7.0): irradiation time = 5 s and irradiation power = 8 μT. (c) A graph quantifying the selectivity of each Eu3+ complex in the presence of other agents: Eu3+-54 (Red), Eu3+-55 (Green), and Eu3+-56 (Blue). Reference , Copyright 2005; Reprinted with permission of John Wiley & Sons, Inc.
(a) Combined PARACEST spectra due to bound water protons at 45 ppm (20 mM), 54 ppm (15 mM) and 64 ppm (11 mM) for Eu 3+-54 (Red), Eu3+-55 (Green) and Eu3+-56 (Blue) respectively The black trace indicates a cocktail of the three complexes (20 mM). CEST spectroscopy conditions (recorded at 400 MHz, 298 K, pH = 7.0): irradiation power = 5 μT and irradiation time = 5 s. (b) Colored images of the three complexes and the cocktail: water (Dark Region), 44 (Red), 45 (Green), and 46 (Blue). CEST MR imaging conditions (recorded at 4.7 T, 298 K, pH = 7.0): irradiation time = 5 s and irradiation power = 8 μT. (c) A graph quantifying the selectivity of each Eu3+ complex in the presence of other agents: Eu3+-54 (Red), Eu3+-55 (Green), and Eu3+-56 (Blue). Reference , Copyright 2005; Reprinted with permission of John Wiley & Sons, Inc.
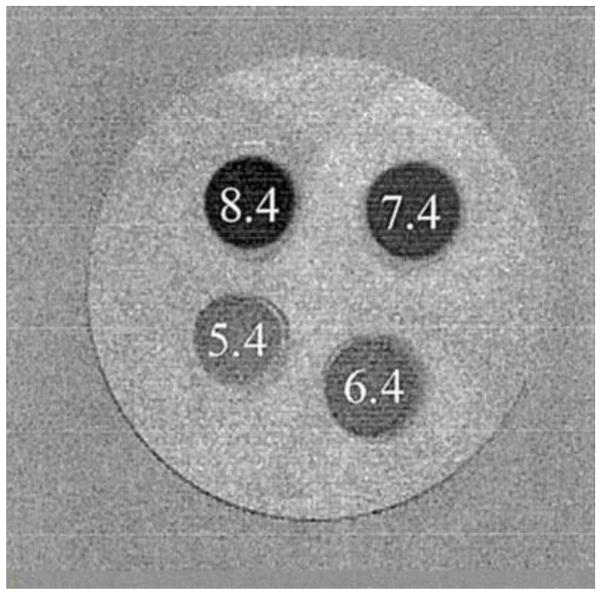
A CEST MR phantom image (M 0-Ms) containing four vials of Yb3+-51 (30 mM) in the pH range of 5.4–8.4. The vials were dipped in water containing 30 mM of Yb3+ aqua-ion. CEST MR imaging conditions (acquired at 7.05 T, 298 K): irradiation time = 4 s and irradiation power = 12 μT. Reference . Copyright (2002); Reprinted with permission of John Wiley & Sons, Inc.
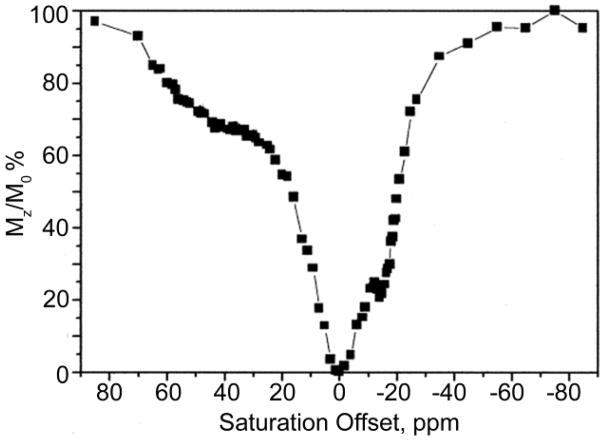
CEST spectrum of a solution containing both Eu3+-51 (16 mM) and Yb3+-51 (20 mM). CEST spectroscopy conditions (recorded at 300 MHz, pH 8.1 312 K): irradiation time = 4 s and irradiation power = 25 μT. Reference . Copyright (2002); Reprinted with permission of John Wiley & Sons, Inc.
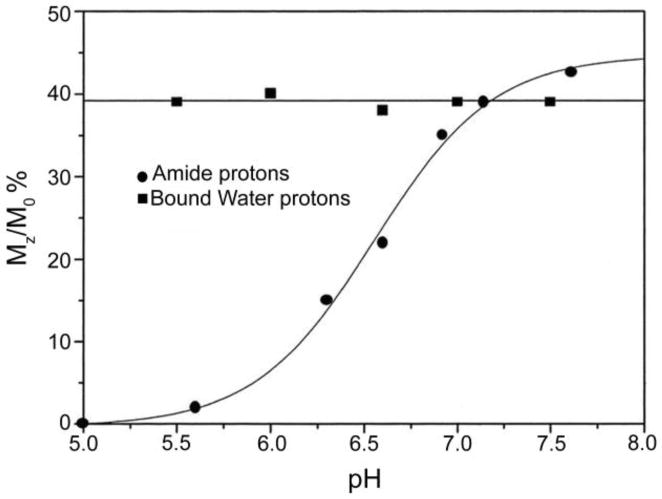
pH dependence of the CEST effect of the amide protons (●) and metal-bound water protons (■) for a 30 mM aqueous solution of Pr3+-51. CEST spectroscopy conditions (300 MHz, 312 K): irradiation time = 4 s, irradiation power = 7 μT (for the amide protons) and 87.6 μT (for the metal-bound water protons).
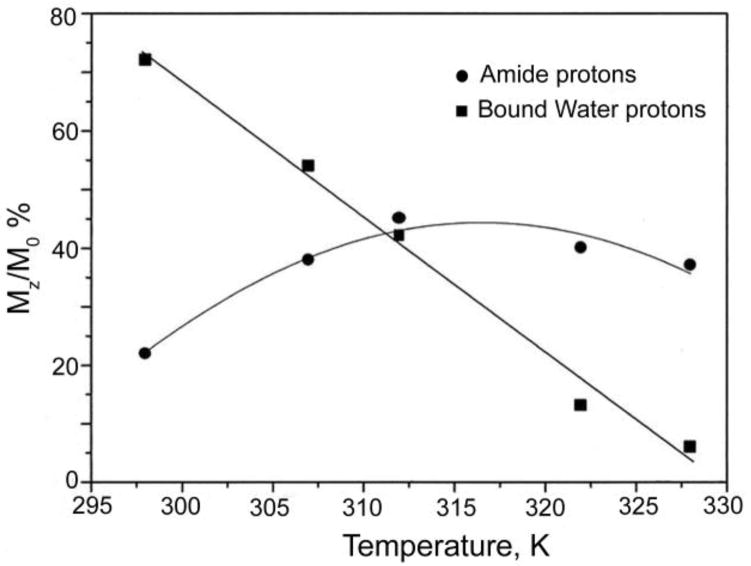
Temperature dependence of the CEST effect of the amide protons (●) and metal-bound water protons (■) for a 30 mM aqueous solution of Pr3+-38. CEST spectroscopy conditions (300 MHz, pH 7.4): irradiation time = 4 s, irradiation power = 7 μT (for the amide protons) and 86.7 μT (for the metal-bound water protons).
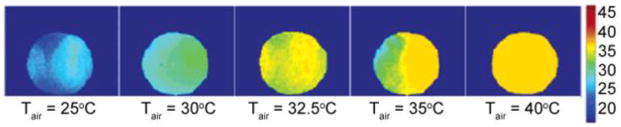
Temperature maps of a phantom containing 1 mL of a 10 mM aqueous solution of Eu3+-51. The temperatures of the air flowing over the sample are indicated in each figure (Tair), while those reported by imaging are shown by the color bar (in units of °C). CEST MR imaging conditions (4.7 T, pH 7.0): irradiation time = 2s and irradiation power = 17 μT. Reproduced with permission from reference , Copyright 2005 American Chemical Society.
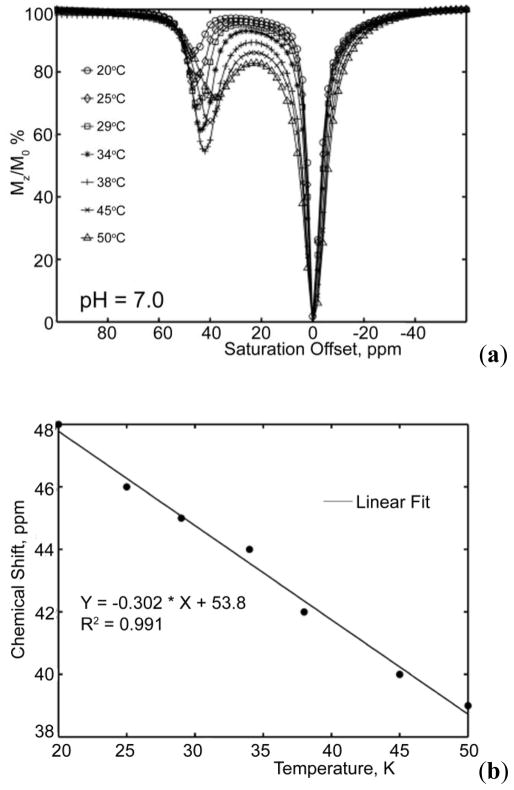
(a) CEST spectra of a 10 mM aqueous solution of Eu3+-57 at different temperatures. (b) Linear dependence of the chemical shift of the bound water protons on temperature for a 10 mM aqueous solution of Eu3+-57. CEST spectroscopy conditions (400 MHz and pH 7.0): irradiation time = 10 s and irradiation power = 14 μT. Reference . Copyright (2008); Reprinted with permission of John Wiley & Sons, Inc.
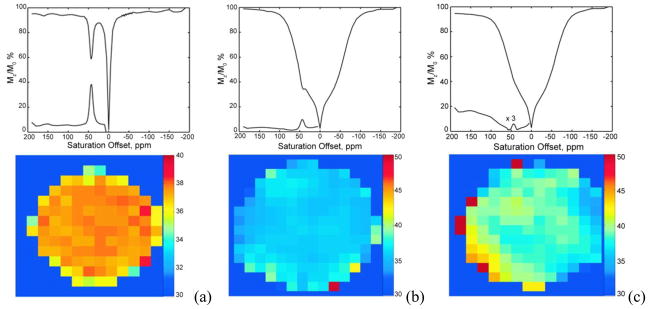
(a) Temperature map of a phantom containing a 10 mM aqueous solution of Eu3+-57 at pH = 7.0, (b) Temperature map of a phantom containing a 15 mM solution of Eu3+-57 with 5% bovine serum albumin at pH = 7.0, and (c) Temperature map of a phantom containing brain tissue with a 4 mM solution of Eu3+-57 at pH = 7.4. The temperature measured by a fiber optic temperature sensor placed adjacent to each phantom was 301.5 K. The corresponding average CEST spectra and the average asymmetry curves are displayed above the temperature maps. CEST MR imaging conditions: irradiation time = 5 s and irradiation power = 15 μT. Reference . Copyright (2008); Reprinted with permission of John Wiley & Sons, Inc.
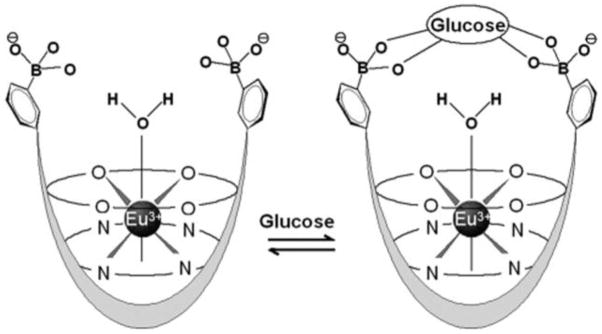
The proposed binding model for Eu3+-58 with glucose. Reference . Copyright (2008); Reprinted with permission of John Wiley & Sons, Inc.
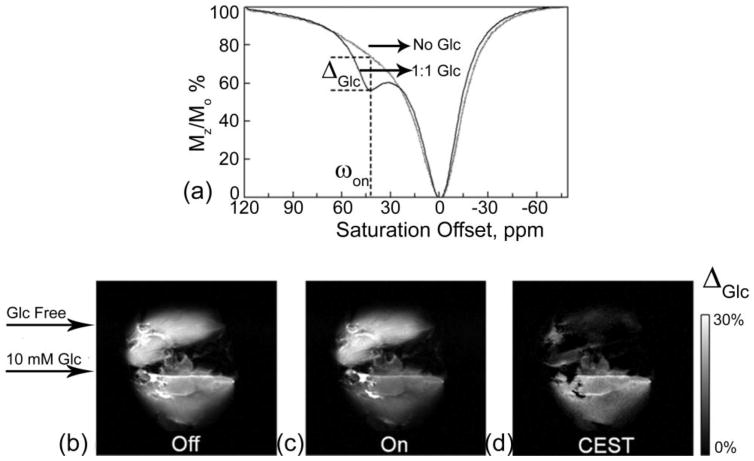
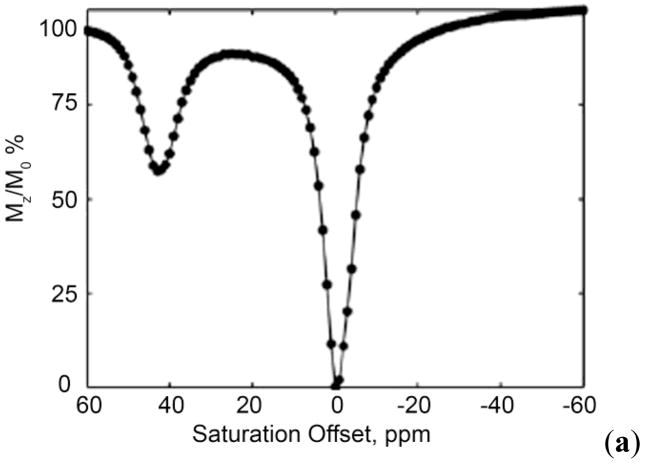
(a) CEST spectra of fresh effluent from a perfused fed-mouse liver (1:1 Glc) and a 24-hr fasted mouse liver (No Glc) at 310 K showing a glucose-induced CEST peak at on 42 ppm. Both perfusates contained 10 mM Eu3+-58 agent, pH 7.4. Off-resonance (b) and on-resonance (c) CEST images of a fed mouse liver (bottom, 10 mM Glc) and a 24-hr fasted mouse liver (top, Glc free) perfused with 10 mM Eu3+-58 agent in the presence (fed liver) and absence (fasted liver) of 10 mM glucose, 310 K. The “off -resonance” image (b) showed no contrast between the two livers while the “on-resonance” image (c) showed image darkening of fed liver versus the fasted mouse liver with on 42 ppm. (d) The CEST difference image showed the glucose induced CEST contrast between the fed and fasted mouse livers. CEST MR imaging conditions: irradiation time = 2 s and irradiation frequency = 23.5 μT. Reference . Copyright (2008); Reprinted with permission of John Wiley & Sons, Inc.
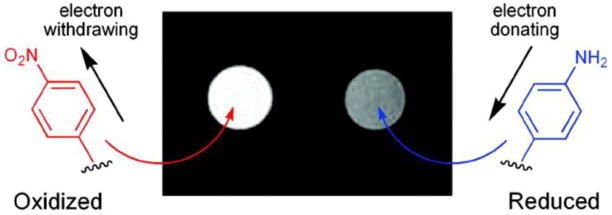
CEST difference images showing that the oxidized and reduced forms of Eu3+-38 can be discriminated by MR imaging. CEST MR imaging conditions (9.4 T, 298 K): irradiation time = 3 s and irradiation power = 24 μT. Reproduced with permission from reference , Copyright 2008 American Chemical Society.
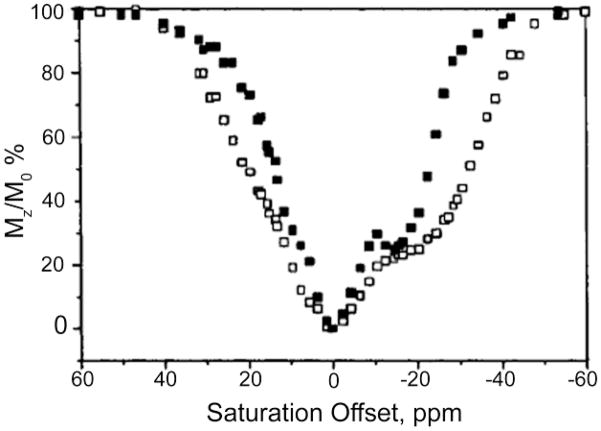
CEST spectra of a 30 mM aqueous solution of Yb3+-59: free (□) and fully bound to L-lactate (■). CEST spectroscopy conditions (300 MHz, pH 7.4, 312 K): irradiation time = 6s and irradiation power = 25 μT. Reproduced with permission from reference , Copyright 2002 American Chemical Society.
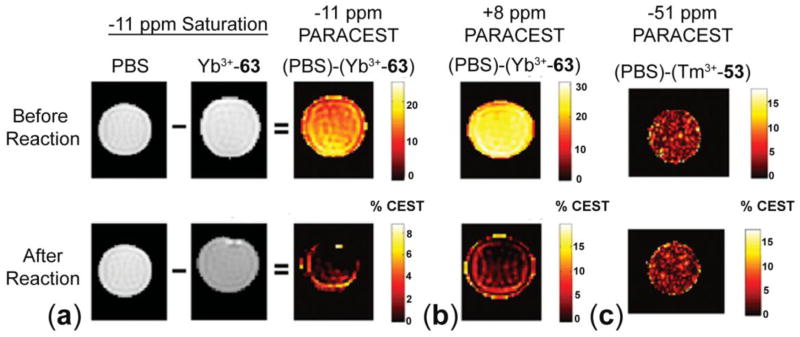
(a) MR images of a 30 mM aqueous solution of Yb3+-60 before and after reaction with nitric oxide in PBS with selective saturation at -11 ppm. Each PARACEST map was independently scaled to demonstrate that only susceptibility artifacts are present in the PARACEST maps of the product after reaction. (b) The PARACEST map of a 30 mM aqueous solution of Yb3+-60 before and after reaction in PBS with selective saturation at +8 ppm. (c) The PARACEST map of a 10 mM aqueous solution of Tm3+-51 before and after applying the same reaction conditions with selective saturation at -51 ppm. CEST MR imaging conditions (9.4 T, 310 K): irradiation power = 30 μT. Reference . Copyright (2007); Reprinted with permission of John Wiley & Sons, Inc.
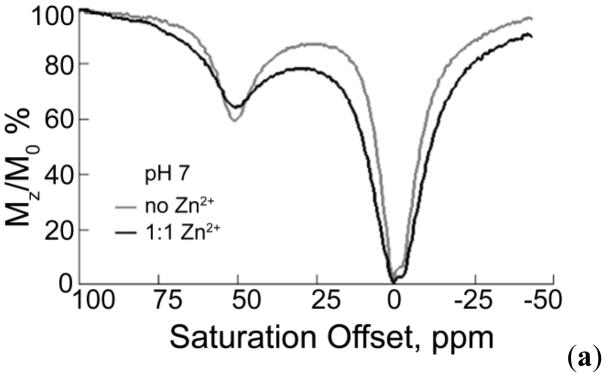
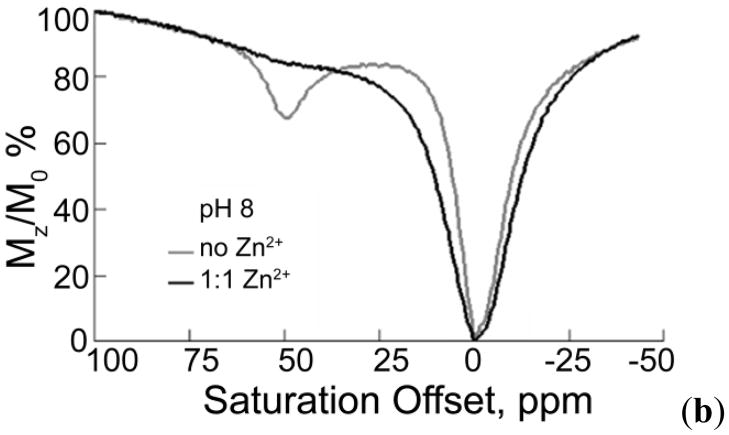
(a) CEST spectra of a 20 mM aqueous solution of Eu3+-61 in the absence (gray line) and in the presence (black line) of 20 mM Zn2+ ions in piperazine-N,N′-bis(ethanesulfonic acid) (PIPES) buffer (100 mm; pH 7.1) at 298 K. (b) CEST spectra of a 20 mM aqueous solution of Eu3+-61 in the absence (gray line) and in the presence (black line) of 20 mM Zn2+ ions in 2,4,6-tris[(dimethylamino)methyl]phenol (DMP) buffer (100 mm; pH 8.0) at 298 K. CEST spectroscopy conditions: irradiation time = 2s, irradiation power = 1000 Hz. Reference . Copyright (2005); Reprinted with permission of John Wiley & Sons, Inc.
(a) CEST spectra of a 20 mM aqueous solution of Eu3+-61 in the absence (gray line) and in the presence (black line) of 20 mM Zn2+ ions in piperazine-N,N′-bis(ethanesulfonic acid) (PIPES) buffer (100 mm; pH 7.1) at 298 K. (b) CEST spectra of a 20 mM aqueous solution of Eu3+-61 in the absence (gray line) and in the presence (black line) of 20 mM Zn2+ ions in 2,4,6-tris[(dimethylamino)methyl]phenol (DMP) buffer (100 mm; pH 8.0) at 298 K. CEST spectroscopy conditions: irradiation time = 2s, irradiation power = 1000 Hz. Reference . Copyright (2005); Reprinted with permission of John Wiley & Sons, Inc.
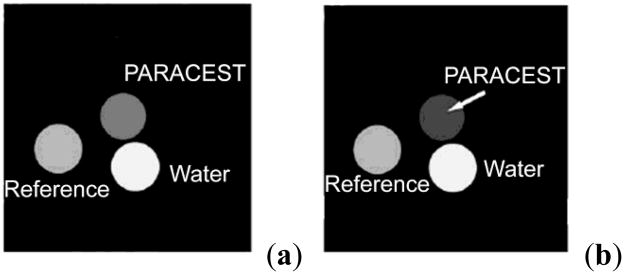
(A) PARACEST spectra and (B) MR parametric map of a 25 mM aqueous solution of Tm3+-62 before and after addition of caspase-3. The deconvoluted PARACEST spectrum of the product after reaction, showing a PARACEST effect at +8 ppm, is also shown. CEST spectroscopy conditions (600 MHz, 310 K and pH 7.4): irradiation time = 4 s and irradiation power = 31 μT. CEST MR imaging conditions (9.4 T, 310 K and pH 7.4): irradiation time = 1.106 s and irradiation power = 50 μT. Reproduced with permission from reference , Copyright 2006 American Chemical Society.
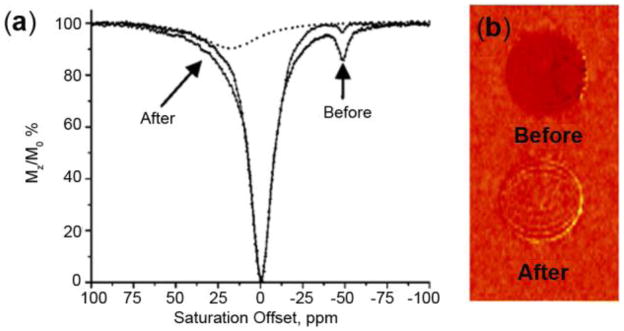
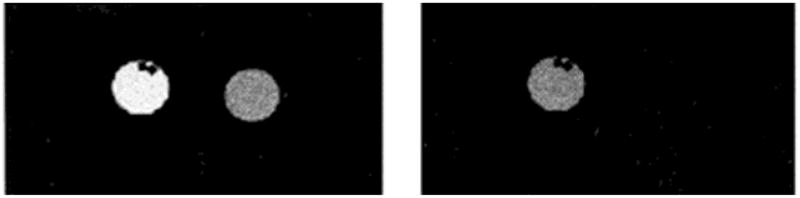
Phantom images of three tubes containing water or a 20 mM aqueous solution of Yb3+-63 before and after enzymatic reaction. The tube marked “Reference” contains the non-cleaved agent, while the tube marked “ParaCEST” contains the agent after enzymatic cleavage. CEST MR imaging conditions (9.4 T, 310 K, pH 7.5): irradiation time = 4 s, irradiation power = 25 μT. The arrow shows the PARACEST effect. Reference . Copyright (2008); Reprinted with permission of John Wiley & Sons, Inc.
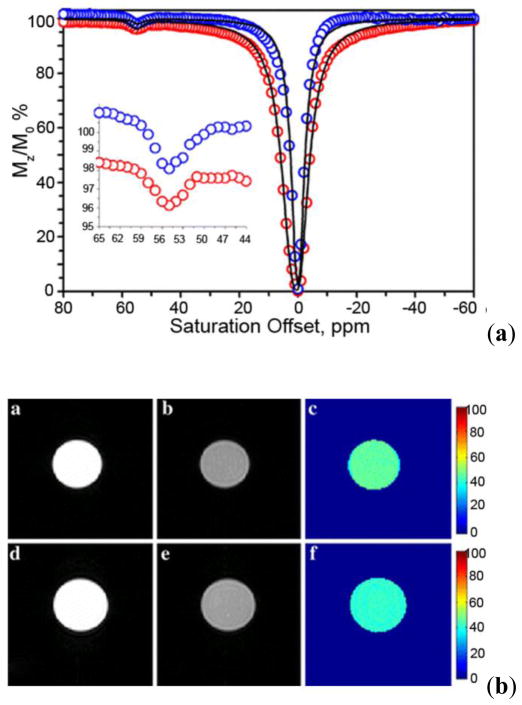
(a) The CEST spectra of a 0.75 mM solution of Eu3+-64 in phosphate-buffered saline (PBS) recorded in the absence (blue) and presence (red) of 0.75 mM HSA. CEST spectroscopy conditions (400 MHz, 298 K): irradiation time = 6 s, irradiation power = 19 μT. (b) Phantom images of a 20 mM solution of Eu3+-64 in the absence (top row) and presence (bottom row) of 5 % HSA. (a) and (d): off-resonance images with irradiation at -54 ppm, (b) and (e): on-resonance images with irradiation at +54 ppm, (c) and (f): CEST difference images. CEST MR imaging conditions (4.7 T, 298 K): irradiation time = 6 s, irradiation power = 19 μT. Reprinted from reference , Copyright (2007), with permission from Elsevier.
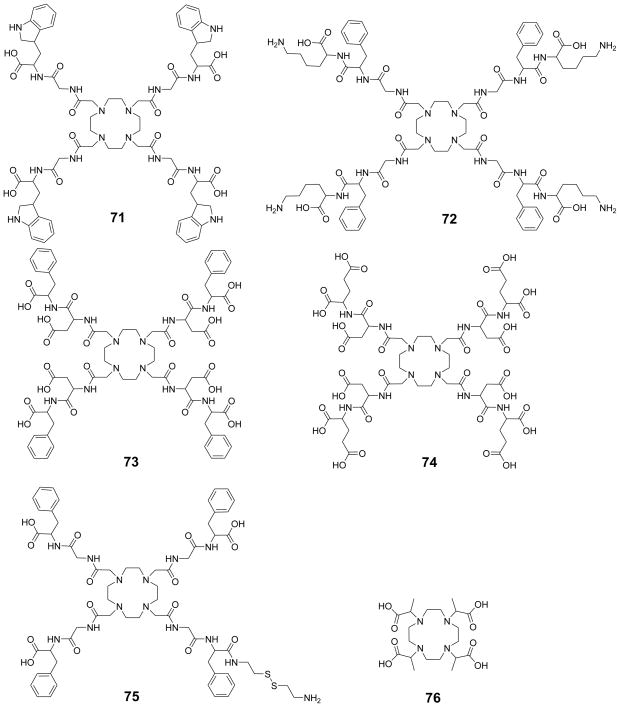
CEST spectra of 10 mM aqueous solutions of Eu3+-70 (a) and Eu3+-71 (b). CEST spectroscopy conditions (9.4 T, 311 K, pH 7): irradiation time = 10 s, irradiation power = 14 μT. Reprinted from reference , Copyright (2007), with permission from Elsevier.
CEST spectra of 10 mM aqueous solutions of Eu3+-70 (a) and Eu3+-71 (b). CEST spectroscopy conditions (9.4 T, 311 K, pH 7): irradiation time = 10 s, irradiation power = 14 μT. Reprinted from reference , Copyright (2007), with permission from Elsevier.
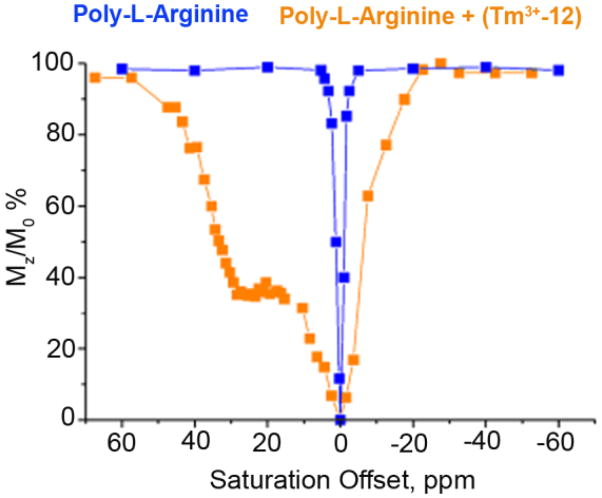
CEST spectra of a 0.1 mM aqueous solution of PLR in the presence (■) and absence (□) of 2.0 mM Tm3+-12. CEST spectroscopy conditions (7.05 T, 312 K, pH 7.4): irradiation time = 2 s, irradiation power = 25 μT. Reference . Copyright (2003); Reprinted with permission of John Wiley & Sons, Inc.
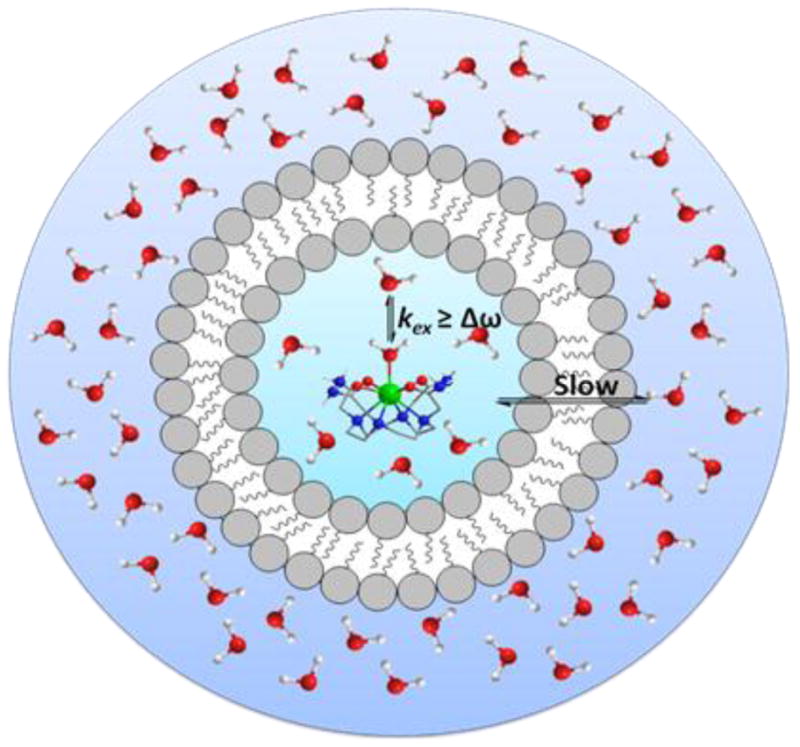
Illustration of a liposome depicting the slow exchange between the outer and inner-core water molecules. The shift reagent is in intermediate-to-fast exchange with all inner-core water molecules.
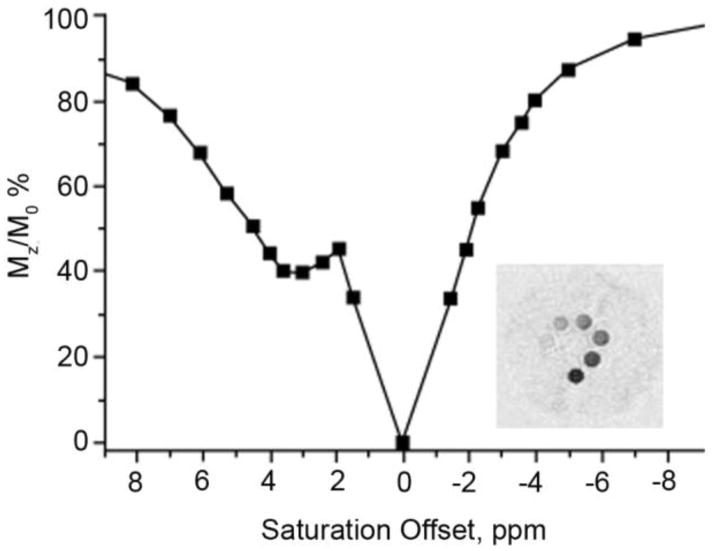
CEST spectrum of a 2.88 nM concentration of liposomes entrapping 0.1 M Tm3+-76. CEST spectroscopy conditions (14.1 T, 312 K): irradiation time = 3 s, irradiation power = 12 μT. (Inset): CEST images of a phantom consisting of eight capillaries containing suspensions of the LIPOCEST agent in the concentration range 22.5–2880 pm entrapping Tm3+-76. CEST MR imaging conditions (7 T, 312 K): irradiation time = 3 s, irradiation power = 12 μT. Reference . Copyright (2003); Reprinted with permission of John Wiley & Sons, Inc.
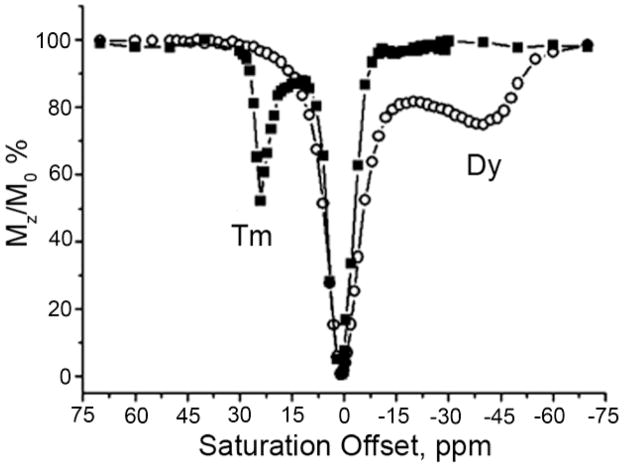
CEST spectra obtained for the two osmotically shrunken LIPOCEST probes encapsulating the hydrophilic shift reagents Tm3+-78 (■) or Dy3+-78 (○) and incorporating the amphiphilic shift reagents Tm3+-77 or Dy3+-77 respectively. CEST spectroscopy conditions (7 T, 312 K): irradiation time = 2 s, irradiation power = 6 μT. Reference . Copyright (2007); Reprinted with permission of John Wiley & Sons, Inc.
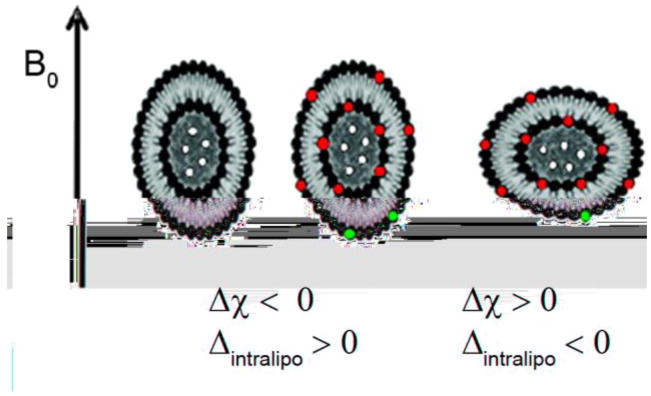
A schematic representation of the preferred orientation of the osmotically shrunken liposomes (assumed to be discoidal) in the static field B0 according to their magnetic susceptibility anisotropy (white circles: paramagnetic entrapped species; red circles: incorporated paramagnetic compound). Δχ represents the magnetic susceptibility tensor of the vesicle components. Reproduced with permission from reference , Copyright 2008 American Chemical Society.
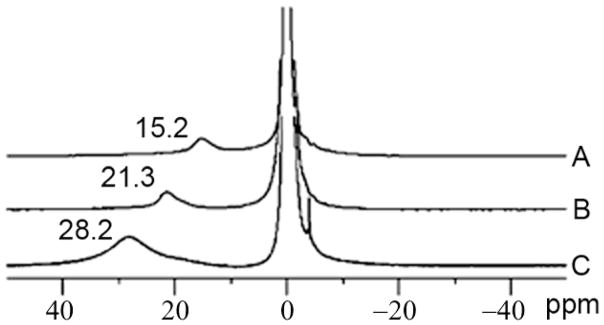
1H-NMR (14.1 T, 298 K) spectra of LIPOCEST suspensions entrapping (A) Tm3+-78, (B) Tm3+–84, or (C) Tm3+ –85 and incorporating Tm3+-77 in the membrane. Reference - Reproduced by permission of the Royal Society of Chemistry.
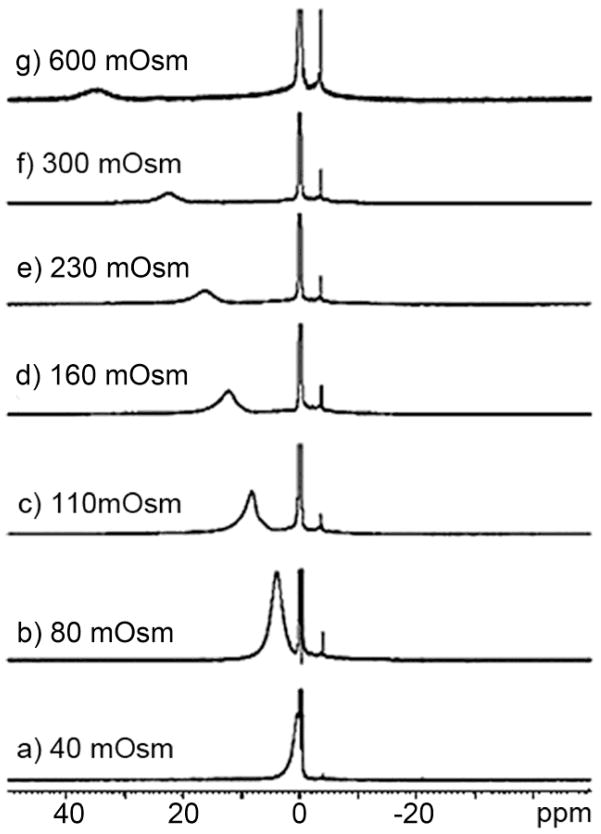
1H NMR spectra (14 T, 298 K) of a suspension of liposomes encapsulating Tm3+-78 (40 mM) and suspended in a buffered medium (pH 7.4) with increasing osmolarity: a) 40, b) 80, c) 110, d) 160, e) 230, f) 300 (isotonic), and g) 600 mOsm. Reference . Copyright (2009); Reprinted with permission of John Wiley & Sons, Inc.
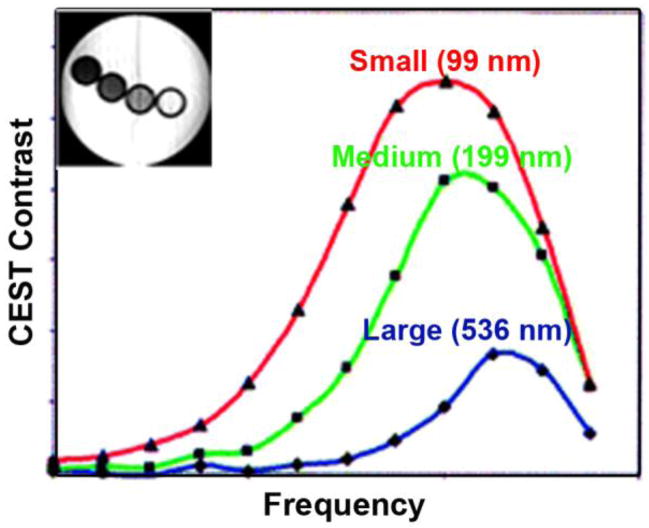
MTRasy vs presaturation frequency offset for three liposome samples of different sizes, each containing 200 mM Tm3+-2. Inset is a CEST difference image of the three samples and PBS buffer: from left to right: 99 nm, 199 nm, 536 nm, buffer. Reproduced with permission from reference , Copyright 2008 American Chemical Society.
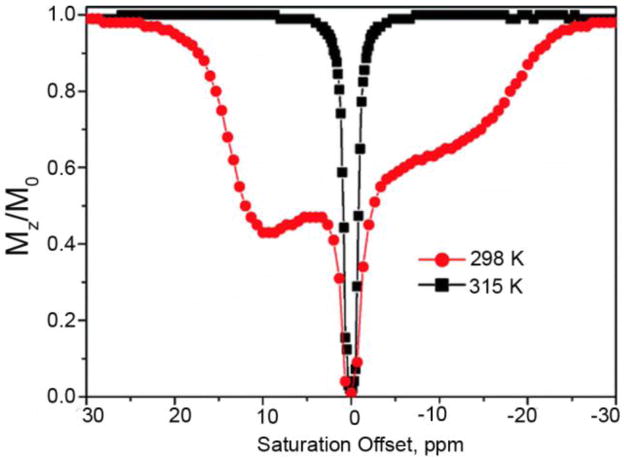
CEST spectra of liposomes containing Tm3+-78 and NH4PF6 at 298 K ( ) at 315 K (■). CEST spectroscopy conditions (7 T): irradiation power = 4.5 μT. Reproduced with permission from reference , Copyright 2008 American Chemical Society.
) at 315 K (■). CEST spectroscopy conditions (7 T): irradiation power = 4.5 μT. Reproduced with permission from reference , Copyright 2008 American Chemical Society.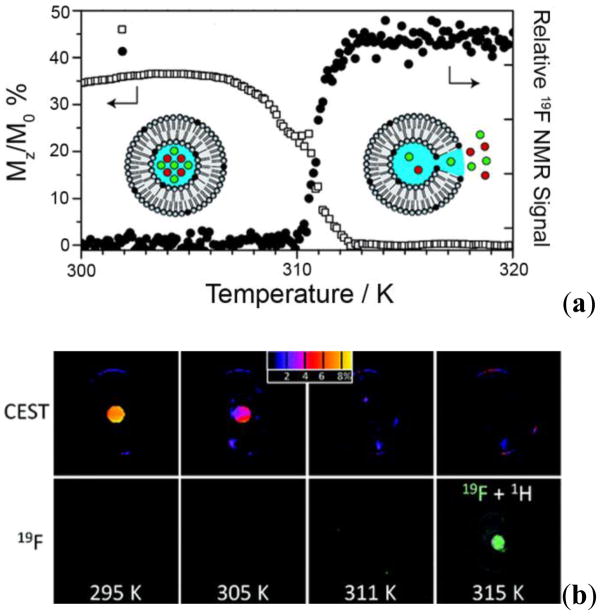
(Top): The DSC thermogram shows the melting temperature of the lipid membrane. (Bottom): 1H LIPOCEST and 19F MR images of the temperature-sensitive liposomes. The CEST signal (color scale in percent) vanished at T ≥ 311 K while the fluorine signal appeared at 315 K. CEST MR imaging conditions (3 T): irradiation power = 3.6 μT. Reproduced with permission from reference , Copyright 2008 American Chemical Society.
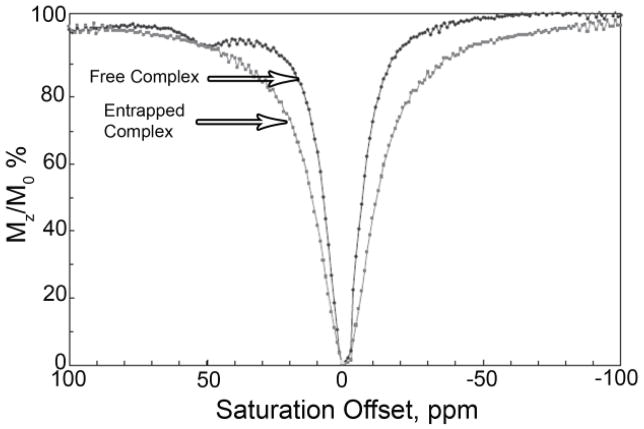
CEST spectra of a 1 mM solution of Eu3+-16 water and entrapped within the ferritin core. CEST spectroscopy conditions (4.7 T, pH = 7, 298 K): irradiation time = 3 s, irradiation power = 1020 Hz. Reference . Copyright (2006); Reprinted with permission of John Wiley & Sons, Inc.
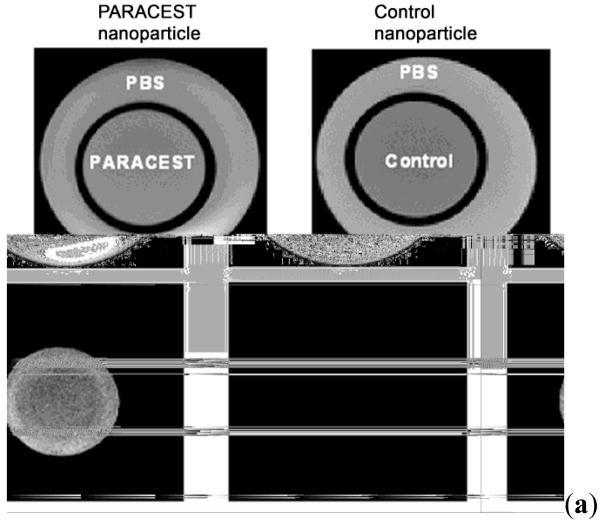
(a): Images of a two-chambered phantom containing PARACEST nanoparticles or control nanoparticles with no PARACEST agent in the inner chamber and PBS in the outer chamber. Top row: off-resonance images at −52 ppm; Bottom row: CEST difference images. (b): Images of fibrin targeted PARACEST vs control nanoparticles bound to plasma clots. Top row: off-resonance images at −52 ppm; Bottom row: CEST difference images indicating significant signal enhancement on the surface of the clot in the PARACEST treated nanoparticles, while no change is observed in the control nanoparticles. Reference . Copyright (2006); Reprinted with permission of John Wiley & Sons, Inc.
(a): Images of a two-chambered phantom containing PARACEST nanoparticles or control nanoparticles with no PARACEST agent in the inner chamber and PBS in the outer chamber. Top row: off-resonance images at −52 ppm; Bottom row: CEST difference images. (b): Images of fibrin targeted PARACEST vs control nanoparticles bound to plasma clots. Top row: off-resonance images at −52 ppm; Bottom row: CEST difference images indicating significant signal enhancement on the surface of the clot in the PARACEST treated nanoparticles, while no change is observed in the control nanoparticles. Reference . Copyright (2006); Reprinted with permission of John Wiley & Sons, Inc.
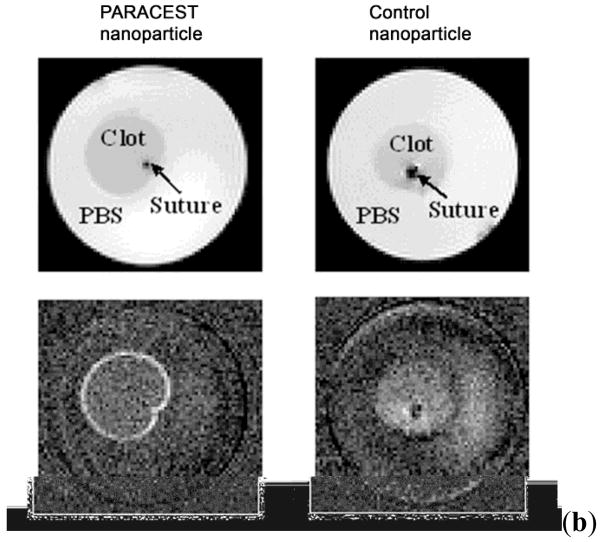
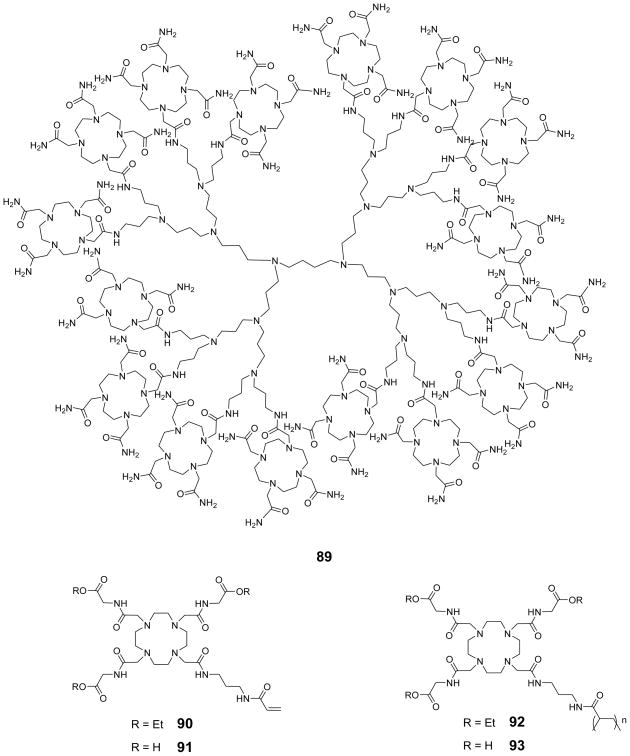
(a): CEST spectra of a 6 mM aqueous solution of the G3 PARACEST agent 89 at three different pH values. CEST spectroscopy conditions (7 T, 310 K): irradiation time = 2 s, irradiation power = 22 μT. (b): Phantom images of aqueous solutions containing the monomer Yb 3+-87 (13 mM, top row) and G3 dendrimer Yb3+-89 (0.8 mM, bottom row) at pH values of 3.2, 6.5 and 7.5, respectively. CEST MR imaging conditions (3 T and 298 K): irradiation time = 2 s, irradiation power = 10.5 μT). Reference . Copyright (2007); Reprinted with permission of John Wiley & Sons, Inc.
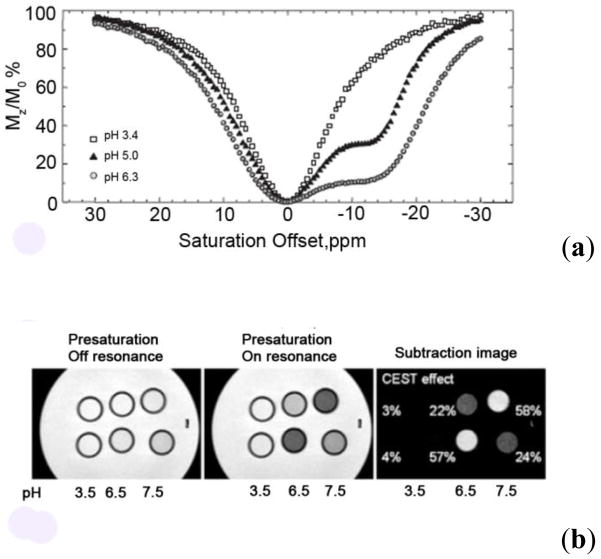
(a) CEST spectra of 30 mM aqueous solutions of Eu3+-91 (red) and Eu 3+-93 (2% initiator concentration, blue). CEST spectroscopy conditions (11.75 T, 298 K): irradiation time = 4 s, irradiation power = 14.1 μT. (Bottom) CEST images of different concentrations of Eu3+-93 and Eu3+-91 phantoms at 9.4 T, 292 K. The agent concentrations (mM) are given for monomer, M, and polymers, P, in (b), and W refers to water as control. (c) Colored CEST difference images. CEST MR imaging conditions (9.4 T, 298 K): irradiation time = 4 s, irradiation power = 14 μT. Reproduced with permission from reference , Copyright 2008 American Chemical Society.
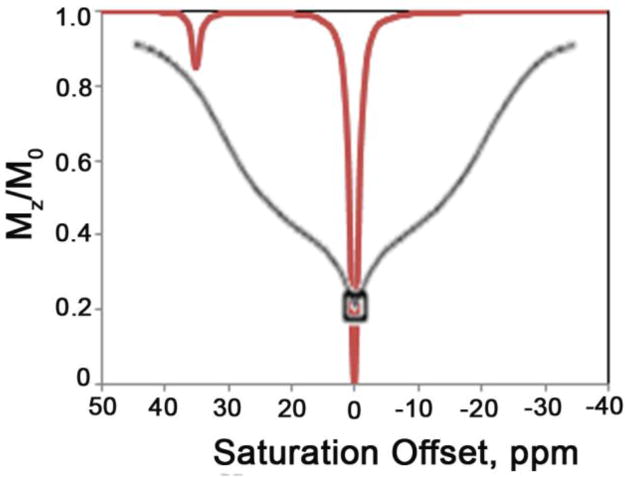
A schematic representation of the differences between a CEST spectrum (red line) and conventional MT effects in tissues (black line).
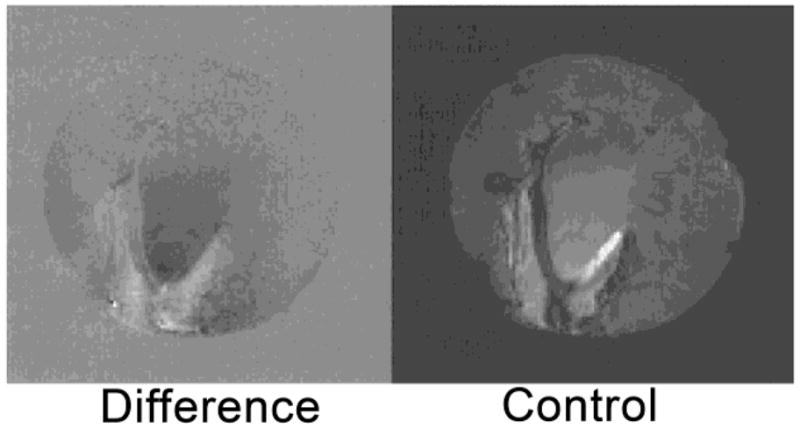
Control and difference images of a rabbit kidney ex vivo indicating chemical exchange effects. The control image corresponds to the off-resonance irradiation at −1.74 ppm, while the difference image corresponds to the difference of the off-resonance from the on-resonance (M0−Ms) image at +1.74 ppm. The darkened regions in the difference image correspond to areas of chemical exchange in the rabbit kidney predominantly due to low molecular weight metabolites. Reprinted from reference , Copyright (1998), with permission from Elsevier.
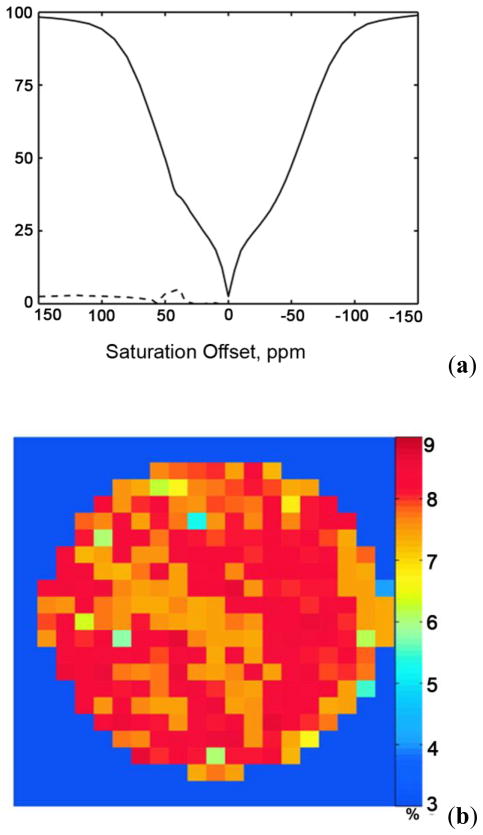
(a) The average CEST spectrum and the average asymmetry curve from a mouse brain tissue phantom with 7 mM Eu3+-57. (34 °C); (b) the corresponding CEST sensitivity map of the mouse brain tissue phantom showing an average CEST sensitivity of 7.9 ± 0.6 % even in the presence of significant MT effects in the tissue. CEST MR imaging conditions (9.4 T): irradiation time = 10 s, irradiation power = 14.1 μT. Reference . Copyright (2008); Reprinted with permission of John Wiley & Sons, Inc.
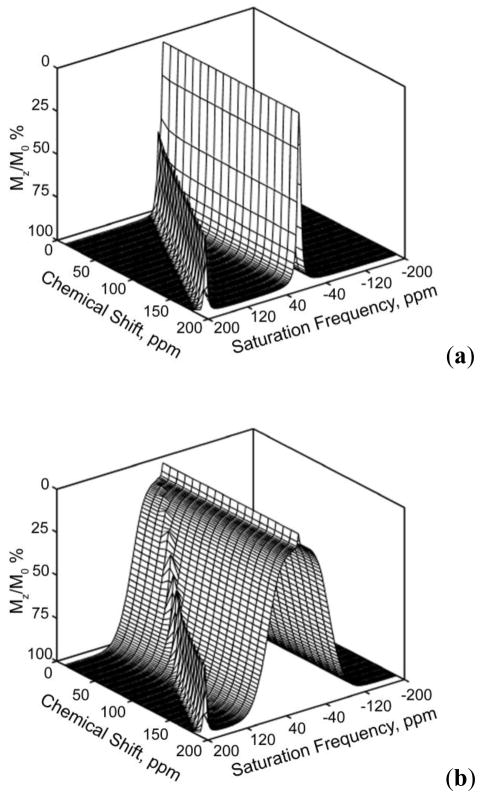
Simulated CEST spectra showing the effect of the PARACEST agent exchangeable proton chemical shift on the CEST efficiency in the absence (a) and presence (b) of macromolecules. Reference . Copyright (2008); Reprinted with permission of John Wiley & Sons, Inc.
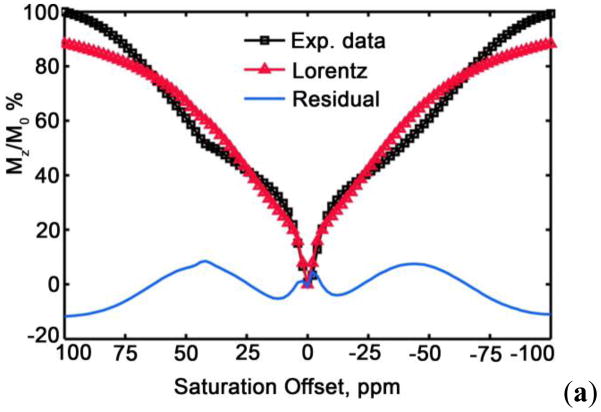
CEST spectra obtained from Vero cells containing the PARACEST agent (Eu3+-57). Three different lineshape functions were used to fit the MT observed from the macromolecules: (a) Lorentzian, (b) Gaussian, and (c) superLorentzian. The residual of each fit is shown at the bottom of each plot. Reference 295. Copyright (2008); Reprinted with permission of John Wiley & Sons, Inc.
CEST spectra obtained from Vero cells containing the PARACEST agent (Eu3+-57). Three different lineshape functions were used to fit the MT observed from the macromolecules: (a) Lorentzian, (b) Gaussian, and (c) superLorentzian. The residual of each fit is shown at the bottom of each plot. Reference 295. Copyright (2008); Reprinted with permission of John Wiley & Sons, Inc.
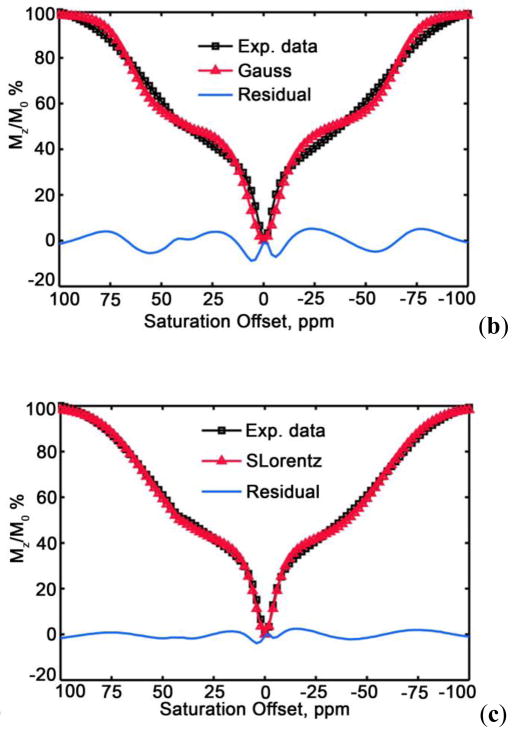
Spin-echo difference images collected at 400 MHz of phantoms containing water and different concentrations of Tm3+-17: 12.5 μM, 125 μM, and 1 mM. Images with WALTZ-16* placed very far off-resonance (effectively switched off) (a), on-resonance (b), and a relative difference image (c). Reprinted from reference 303, Copyright (2005), with permission from Elsevier.
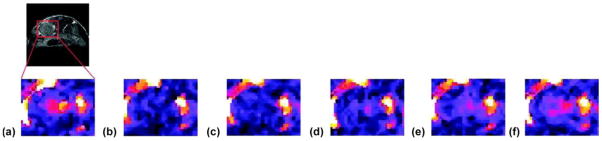
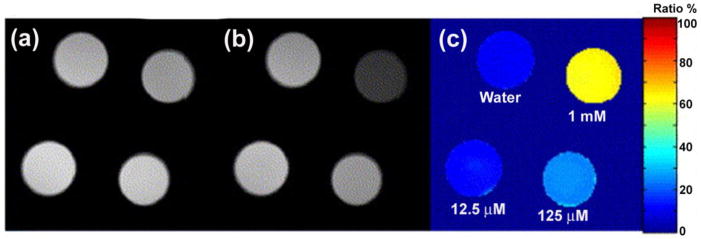
Typical WALTZ-SE (spin echo images using WALTZ-16*) in vivo images of the kidney (zoomed in on the area marked approximately on the anatomical image in the upper left corner). Images are taken right before (a) and after 2 min 40 sec (b); 5 min 20 sec (c); 10 min 40 sec (d); 16 min (e); and 18 min 40 sec (f) from the beginning of the Tm-51 bolus injection (all the timings correspond to the beginning of image acquisition). The maximum intensity decrease is observed around 3 min (b). As the agent clears through the kidney, the intensity starts to return to the levels seen prior to the agent injection (d–f). Reference 332. Copyright (2007); Reprinted with permission of John Wiley & Sons, Inc.
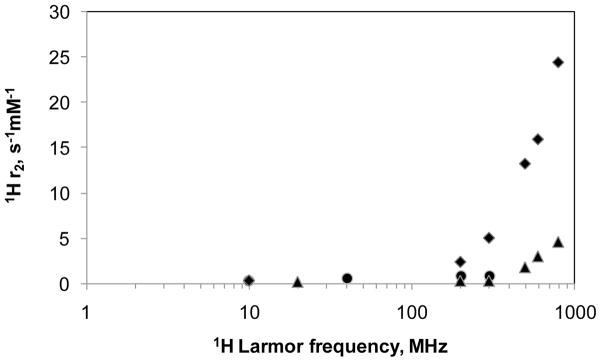
The dependence of the water 1H transverse relaxivity (r2) for a solution of Dy3+-99 (◆), Dy3+-16 (●) and Dy3+-1 (▲) at 298 K. Adapted from references 314 (Copyright 2002; Reprinted with permission of John Wiley & Sons, Inc.) and 328 (Reprinted from reference 328, Copyright (2002), with permission from Elsevier). ,
The spin echo images at 4.7 T and room temperature of a phantom containing Dy 3+-1 and Dy3+-101. Reference 314. Copyright (2002); Reprinted with permission of John Wiley & Sons, Inc.
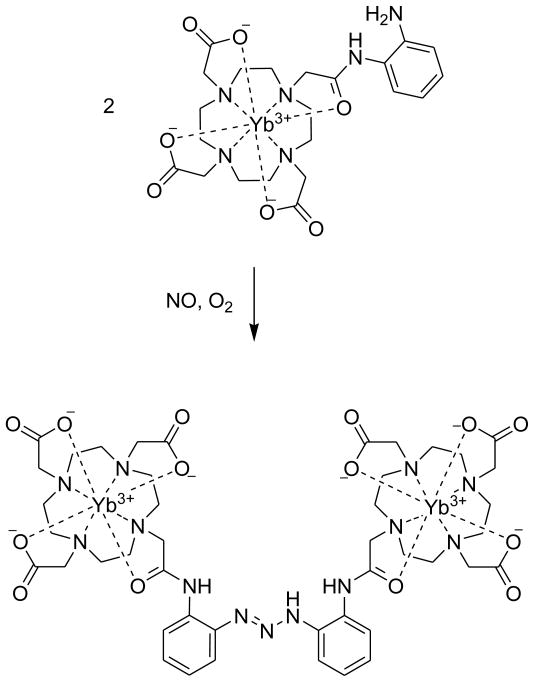
Illustration of the irreversible conversion of Yb3+-63 in the presence of oxygen.
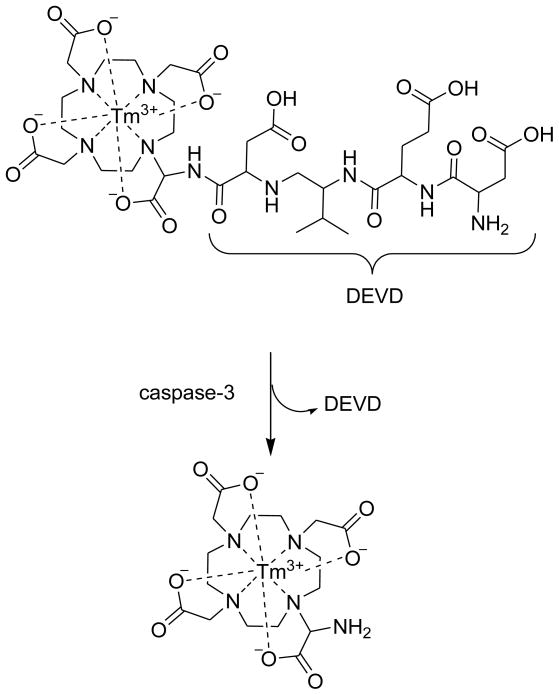
Representation of the reaction of Tm3+-65 with Caspase-3.
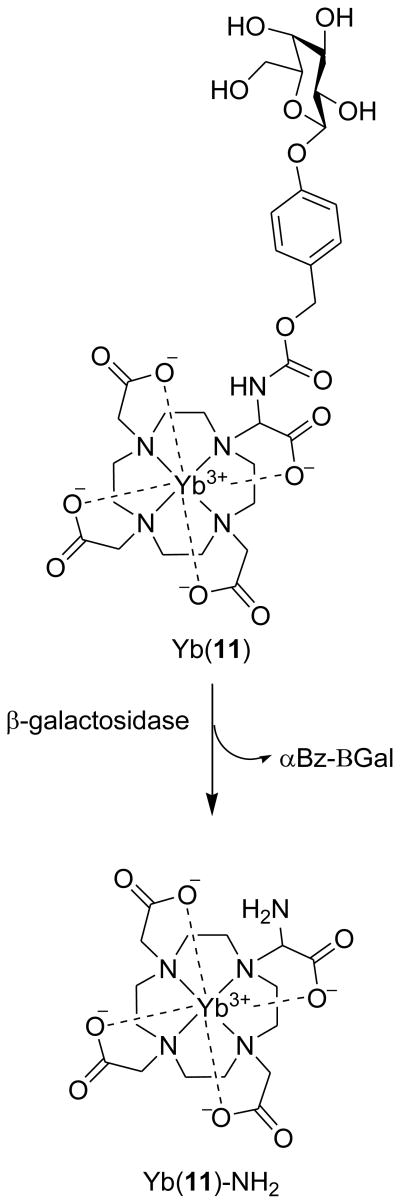
Enzymatic activation of Yb3+-66 with β-galactosidase.
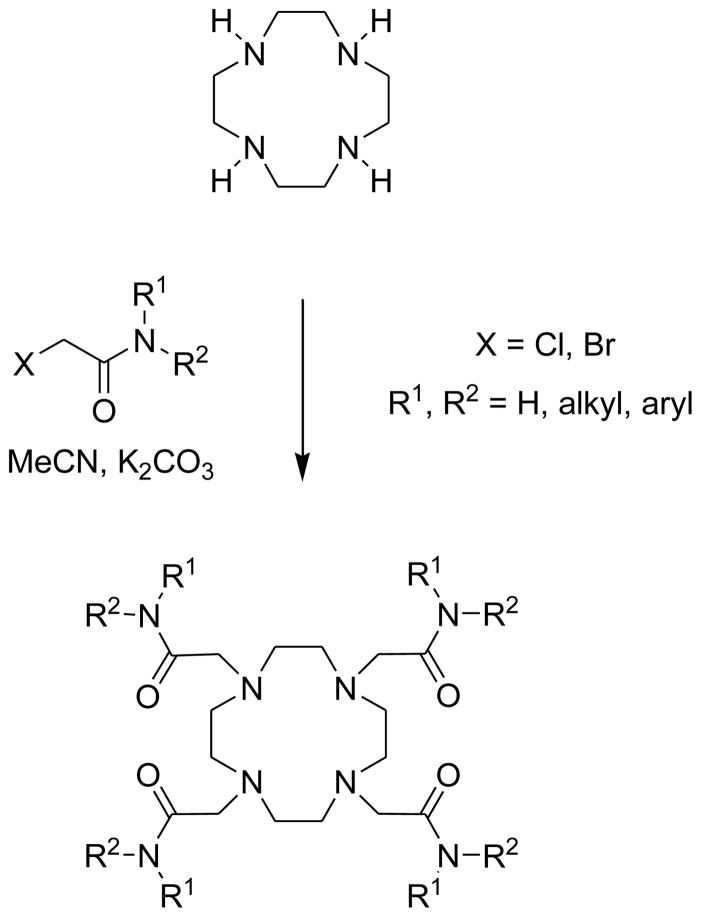
Synthesis of DOTA tetraamide ligands by the alkylation of cyclen
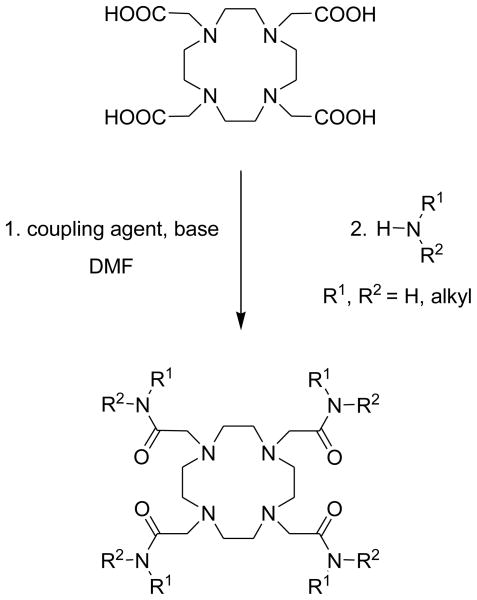
Synthesis of DOTA tetraamide ligands by activating DOTA
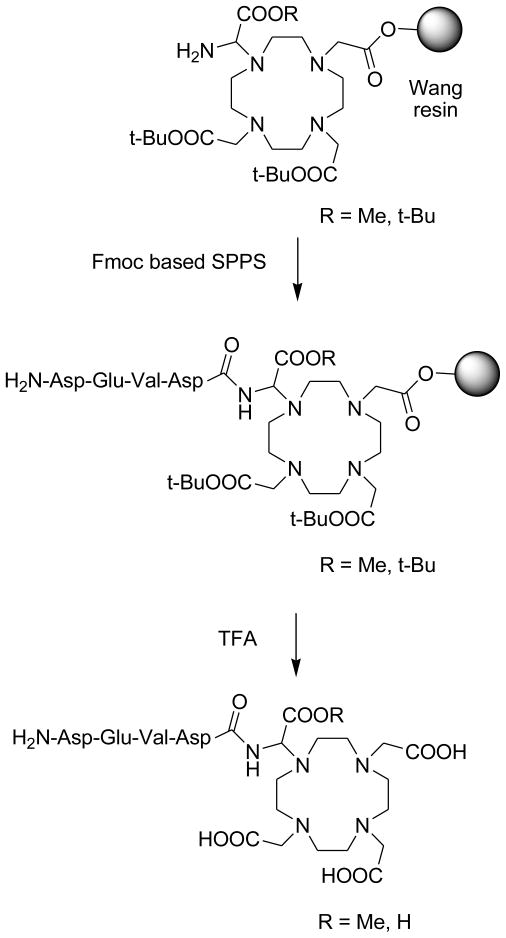
Solid phase synthesis of peptidyl amido DOTA derivatives
References
Publication types
MeSH terms
Substances
Grants and funding
LinkOut - more resources
Full Text Sources
Other Literature Sources
Medical
