. 2010 May 12;132(18):6474-80.
doi: 10.1021/ja1007849.

Solvation response along the reaction coordinate in the active site of ketosteroid isomerase

Affiliations

Solvation response along the reaction coordinate in the active site of ketosteroid isomerase

William Childs et al. J Am Chem Soc. .

Abstract

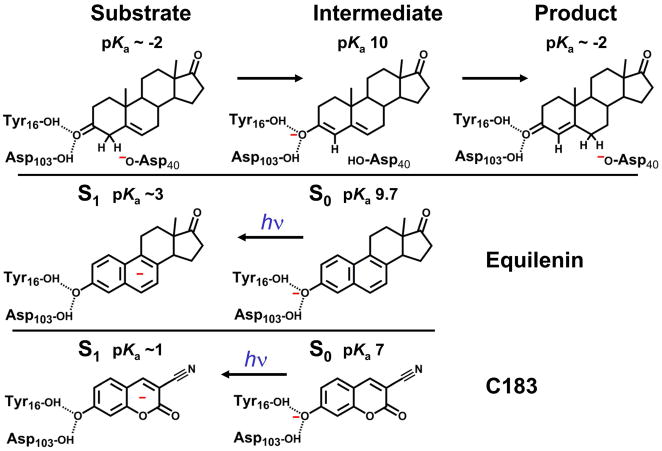
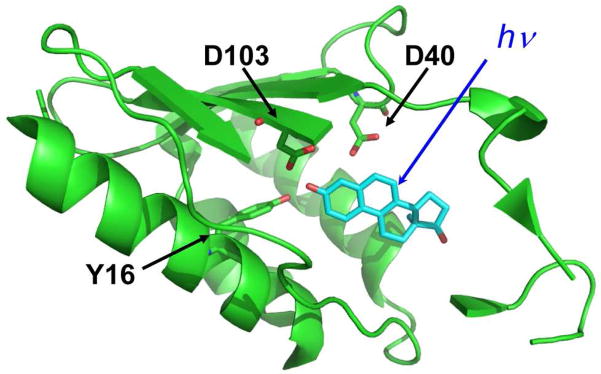
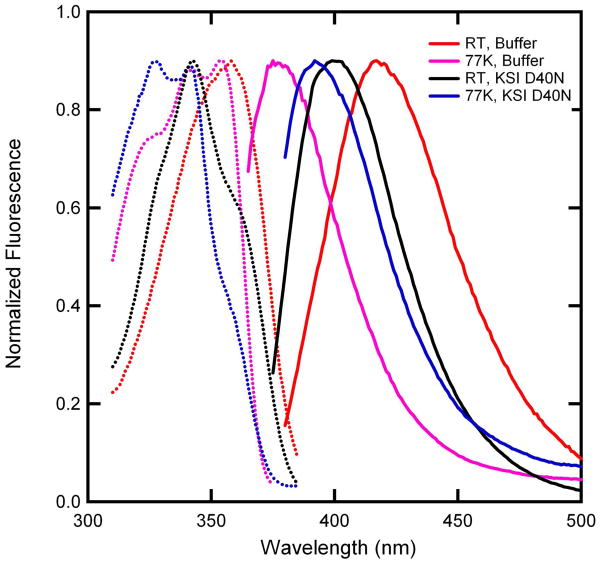
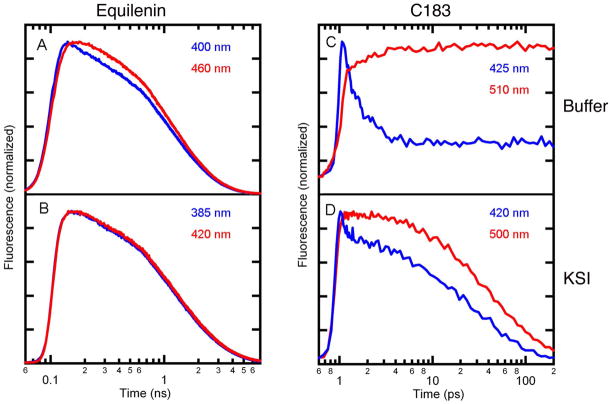
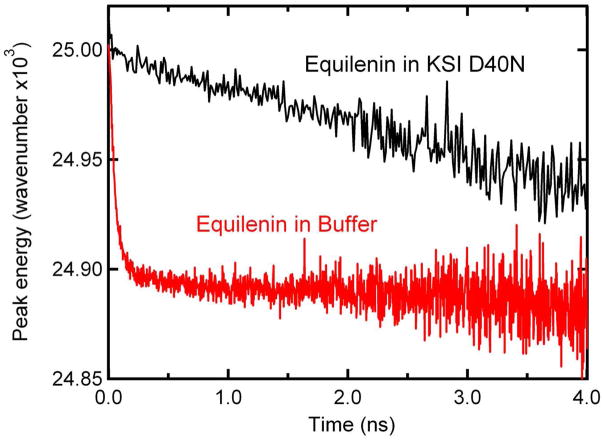
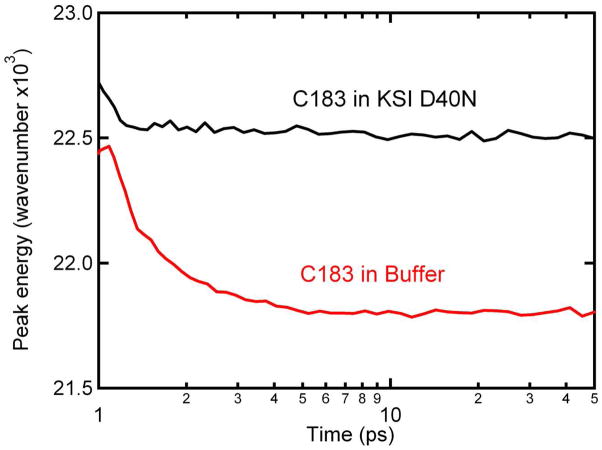
A light-activated reaction analog has been developed to mimic the catalytic reaction cycle of Delta(5)-3-ketosteroid isomerase to probe the functionally relevant protein solvation response to the catalytic charge transfer. Delta(5)-3-ketosteroid isomerase from Pseudomonas putida catalyzes a C-H bond cleavage and formation through an enolate intermediate. Conversion of the ketone substrate to the enolate intermediate is simulated by a photoacid bound to the active site oxyanion hole. In the ground state, the photoacid electrostatically resembles the enolate intermediate while the low pK(a) excited state resembles the ketone starting material. Time-resolved fluorescence experiments with photoacids coumarin 183 and equilenin show the active site of Delta(5)-3-ketosteroid isomerase to be largely unperturbed by the light-activated reaction. The small solvation response for the photoacid at the active site as compared with a simple solvent suggests the active site does not significantly change its electrostatic environment during the catalytic cycle. Instead, the reaction takes place in an electrostatically preorganized environment.


Figures

Figure 1
Figure 1
The enzymatic reaction for ketosteroid isomerase (top) is compared to the equilenin (middle) and C183 (bottom) photocycle.
Figure 2
Figure 2
Crystal structure 1oh0 of equilenin (blue) bound to KSI from Pseudomonas putida (green). Two β-stands that form one side of the active site pocket have been removed for viewing purposes.
Figure 3
Figure 3
Normalized steady-state fluorescence excitation and emission spectra of equilenin. Emission from KSI bound equilenin at room temperature (solid, black) and 77 K (solid, blue) was observed from 350 nm and 365 nm excitation, respectively. Corresponding excitation spectra (broken line with matching color) were observed from 400 nm emission. Emission from equilenin in buffer at room temperature (solid, red) and 77 K (solid, purple) was observed from excitation at 360 nm and 350 nm, respectively. Excitation spectra (broken lines) of the room temperature sample (red) were observed from emission at 420 nm while the 77 K sample (purple) was observed from 390 nm emission. The protein-bound spectra were taken in pH 7, 40 mM potassium phosphate buffer while the unbound spectra were determined in 0.5 M NaOH. All spectra were obtained in 50% glycerol.
Figure 4
Figure 4
Fluorescence decay curves of equilenin (A and B) and C183 (C and D) in buffer and bound to KSI measured on the blue and red side of the emission bands. The time-resolved fluorescence intensity of equilenin in buffer (A) and KSI D40N (B) was measured with TCSPC, which provides a ~ 22 ps instrument response. For the purposes of graphing, time zero for the TCSPC was set to 100 ps. Time-resolved fluorescence intensity of C183 in buffer (C) and KSI D40N (D) was measured by fluorescence upconversion, which provides a ~150 fs instrument response. Time zero for upconversion experiment was set to 1 ps.
Figure 5
Figure 5
Time-resolved peak emission energy for equilenin in KSI (black) and buffer (red). For purposes of graphing, the data from equilenin in buffer (red) has been shifted up in energy by 1150 cm-1. Time-resolved fluorescence was observed with TCSPC, which has an instrument response function of ~22 ps.
Figure 6
Figure 6
Time-resolved peak emission energy for C183 in KSI (black) and buffer (red). Time-resolved fluorescence was observed with fluorescence upconversion, which has an instrument response function of ~150 fs. For the purposes of graphing, time-zero was set to 1 ps. Note that the horizontal axis is log time and covers a very different range than in Figure 5.

Similar articles

Cited by

References

    1. Perutz MF. Science. 1978;201:1187. - PubMed
    1. Warshel A. J Bio Chem. 1998;273:27035. - PubMed
    1. Kraut DA, Sigala PA, Pybus B, Liu CW, Ringe D, Petsko GA, Herschlag D. PLoS Biol. 2006;4:e99. - PMC - PubMed
    1. Warshel A, Sharma PK, Chu ZT, Aqvist J. Biochemistry. 2007;46:1446. - PubMed
    1. Kamerlin SCL, Sharma PK, Chu ZT, Warshel A. Proc Natl Acad Sci USA. 2010 early Edition.

Publication types