. 2010 Apr 15:11:241.
doi: 10.1186/1471-2164-11-241.

Signal pathways JNK and NF-kappaB, identified by global gene expression profiling, are involved in regulation of TNFalpha-induced mPGES-1 and COX-2 expression in gingival fibroblasts

Affiliations

Signal pathways JNK and NF-kappaB, identified by global gene expression profiling, are involved in regulation of TNFalpha-induced mPGES-1 and COX-2 expression in gingival fibroblasts

Tove Båge et al. BMC Genomics. .

Abstract

Background: Prostaglandin E2 (PGE2) is involved in several chronic inflammatory diseases including periodontitis, which causes loss of the gingival tissue and alveolar bone supporting the teeth. We have previously shown that tumor necrosis factor alpha (TNFalpha) induces PGE2 synthesis in gingival fibroblasts. In this study we aimed to investigate the global gene expression profile of TNFalpha-stimulated primary human gingival fibroblasts, focusing on signal pathways related to the PGE2-synthesizing enzymes prostaglandin E synthases (PGES), as well as the upstream enzyme cyclooxygenase-2 (COX-2) and PGE2 production.

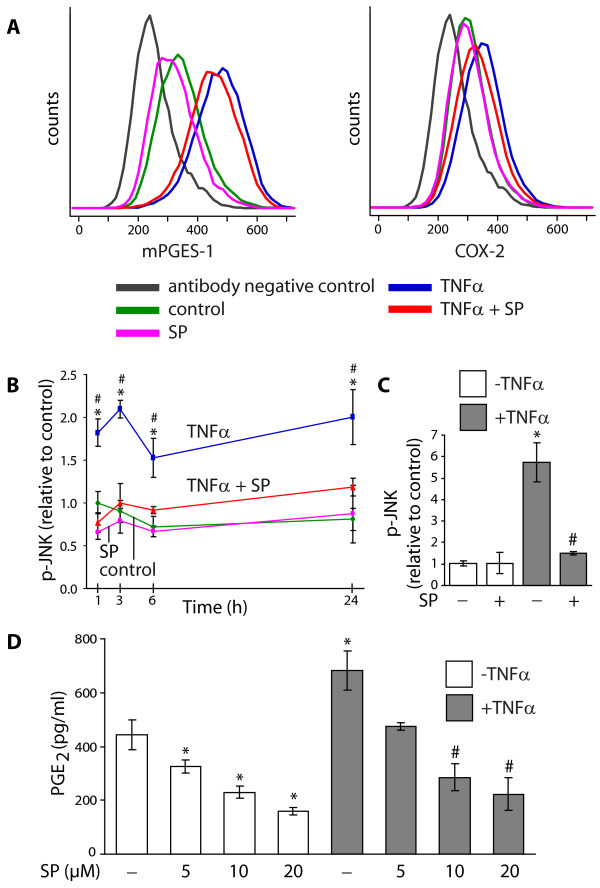
Results: Microarray and western blot analyses showed that the mRNA and protein expression of the inflammatory induced microsomal prostaglandin E synthase-1 (mPGES-1) was up-regulated by the cytokine TNFalpha, accompanied by enhanced expression of COX-2 and increased production of PGE2. In contrast, the expression of the isoenzymes microsomal prostaglandin E synthase-2 (mPGES-2) and cytosolic prostaglandin E synthase (cPGES) was unaffected by TNFalpha treatment. Using oligonucleotide microarray analysis in a time-course factorial design including time points 1, 3 and 6 h, differentially expressed genes in response to TNFalpha treatment were identified. Enrichment analysis of microarray data indicated two positively regulated signal transduction pathways: c-Jun N-terminal kinase (JNK) and Nuclear Factor-kappaB (NF-kappaB). To evaluate their involvement in the regulation of mPGES-1 and COX-2 expression, we used specific inhibitors as well as phosphorylation analysis. Phosphorylation analysis of JNK (T183/Y185) and NF-kappaB p65 (S536) showed increased phosphorylation in response to TNFalpha treatment, which was decreased by specific inhibitors of JNK (SP600125) and NF-kappaB (Bay 11-7082, Ro 106-9920). Inhibitors of JNK and NF-kappaB also decreased the TNFalpha-stimulated up-regulation of mPGES-1 and COX-2 as well as PGE2 production.

Conclusion: In the global gene expression profile, the enrichment analysis of microarray data identified the two signal transduction pathways JNK and NF-kappaB as positively regulated by the cytokine TNFalpha. Inhibition of these TNFalpha-activated signal pathways reduced the expression of mPGES-1 and COX-2 as well as their end product PGE2 in gingival fibroblasts. The involvement of the signal pathways JNK and NF-kappaB in the regulation of PGE2 induced by TNFalpha may suggest these two pathways as possible attractive targets in the chronic inflammatory disease periodontitis.


Figures

Figure 1
Figure 1
Effect of TNFα on protein expression of PGE synthases and COX-2 and production of PGE2. (A) Gingival fibroblasts were treated with TNFα (20 ng/ml) or without TNFα for the indicated time period. Cells were harvested, total protein was extracted and protein expression of the PGE2-synthesizing enzymes mPGES-1, mPGES-2, cPGES and COX-2 as well as the loading control actin was analyzed by western blot. (B) Gingival fibroblasts were stimulated with TNFα (20 ng/ml) or cultured without TNFα (control) for 24 h. Protein expression of mPGES-1, mPGES-2, cPGES and COX-2 was investigated by flow cytometry, using specific antibodies. (C) Gingival fibroblasts were cultured with or without TNFα (20 ng/ml) for the indicated time period. Levels of PGE2 in the culture media were measured by EIA on a Luminex system, and are presented as mean ± s.d. Asterisks (*) indicate a significant difference from untreated cells at the corresponding time point (p < 0.05). The results are representative for all three cell lines and all analyses were performed in triplicates.
Figure 2
Figure 2
Effect of TNFα on mRNA expression of PGE synthases and COX-2. Gingival fibroblasts were treated with TNFα (20 ng/ml) or without TNFα for the indicated time period. Total RNA was extracted from gingival fibroblasts, and mRNA expression of the PGE2 synthesizing enzymes mPGES-1, mPGES-2, cPGES and COX-2, was measured by microarray analysis, using specific probes for each enzyme. Two probes for each of the PGE synthase isoenzymes mPGES-1 and cPGES were present on the chip used in the microarray analysis. The y-axis displays the M-value which is the log2 of the ratio gene expression of TNFα treated cells/gene expression of control cells. A positive number corresponds to higher expression in the TNFα treated cells. The x-axis corresponds to the different time points. A filled circle denotes a significant differentially expressed gene at the indicated time point whereas an empty circle denotes no significant difference.
Figure 3
Figure 3
Microarray experimental design and volcano plots displaying differential expression between TNFα-treated and control cells. (A) For each of the three gingival fibroblast cell lines, cells were treated with TNFα (20 ng/ml) or cultured without TNFα for 1, 3 or 6 h. Samples were labeled and hybridized on oligonucleotide microarrays. Each arrow corresponds to one hybridization where the green sample is labeled with Cy3 and the red sample with Cy5. (B-D) The y axis displays the negative false discovery rate (-FDR) on a log10 scale and the x axis displays the M-value which is the log2 of the ratio gene expression of TNFα treated cells/gene expression of control cells. A positive M-value corresponds to higher expression in the TNFα treated cells. The vertical line signifies a false discovery rate of 0.05, and all genes above it are considered differentially expressed. (B) At time point 1 h, 1157 genes were differentially expressed in response to TNFα. For (C) and (D), the differentially expressed genes at the later time point were compared with the differentially expressed genes at the earlier time point, to retrieve the genes that were differentially expressed due to time and treatment between those time points. (C) Between time points 1 h and 3 h, 796 genes were differentially regulated due to TNFα treatment. (D) Between time points 3 h and 6 h, 553 genes were differentially regulated due to TNFα treatment.
Figure 4
Figure 4
Gene Ontology analysis of differentially expressed genes. Gingival fibroblasts were cultured with or without TNFα (20 ng/ml), and cDNA samples were hybridized to an oligonucleotide microarray. Enrichment analysis was performed to identify biological themes among the genes that were differentially expressed in the different comparisons. The plot shows a selection of the gene ontology (GO) categories that were overrepresented among the genes having a significant change in expression between 1 h and 3 h due to TNFα treatment. The color of each node illustrates significance and can be interpreted in the scale bar, which displays the false discovery rate on a log10 scale. Arrows indicate the parent to child direction. For clarity, due to space reasons the figure does not include all significant GO categories. Complete lists of significant GO categories for the different comparisons can be found in the additional material (Additional files 2, 5 and 8).
Figure 5
Figure 5
Heat map. A heat map demonstrating the relative level of differentially expressed genes between the time points 1 h and 3 h. The color of each gene relates to its M-value (log2 ratio of (gene expression of TNFα treated cells/gene expression of control cells)). A positive M-value corresponds to a higher expression in the TNFα treated cells. Gene symbols [91] are used for gene identification. The three columns represent the three cell lines used in the study. (A) Heat map for the GO-term GO:0046330 (positive regulation of JNK cascade). (B) Heat map for the GO-term GO:0043123 (positive regulation of I-kappaB kinase/NF-kappaB cascade).
Figure 6
Figure 6
Involvement of C-Jun N-terminal kinase (JNK) in the regulation of mPGES-1 and COX-2. (A) Gingival fibroblasts were treated with TNFα (20 ng/ml) with or without the JNK inhibitor SP600125 (SP, 10 μM) for 24 h. Expression of mPGES-1 and COX-2 was measured by flow cytometry using specific antibodies. (B-C) Gingival fibroblasts were treated with TNFα (20 ng/ml) with or without SP (10 μM) for 1, 3, 6 and 24 h (B) or 10 minutes (C). Cells were lysed and total protein was analyzed for phosphorylated JNK (p-JNK) and expressed as relative to control cells at 1 h (B) or at start of incubation (C). Data is presented as mean ± s.d. Asterisks (*) indicate a significant difference (p < 0.05) between TNFα-stimulated cells and control cells at each time point, and hash symbols (#) indicate a significant difference (p < 0.05) between TNFα-stimulated cells and cells treated with TNFα in combination with SP at each time point. (D) Gingival fibroblasts were cultured with the indicated doses of SP in the absence or presence of TNFα (20 ng/ml) for 24 h. Levels of PGE2 in the culture media were measured by EIA using Luminex technology. Data is presented as mean ± s.d. Asterisks (*) indicate a significant difference compared to control cells not treated with TNFα or SP, and hash symbols (#) indicate a significant difference compared to cells treated with TNFα only (p < 0.05). The results are representative for all three cell lines and all analyses were performed in triplicates.
Figure 7
Figure 7
Involvement of Nuclear Factor-kappaB (NF-κB) in mPGES-1 and COX-2 regulation. (A) Gingival fibroblasts were treated with TNFα (20 ng/ml) with or without the NF-κB pathway inhibitor Bay 11-7082 (Bay, 2.0 μM) for 24 h. Expression of mPGES-1 and COX-2 was measured by flow cytometry using specific antibodies. (B-C) Gingival fibroblasts were treated with TNFα (20 ng/ml) with or without Bay (2.0 μM) for 1, 3, 6 and 24 h (B) or 10 minutes (C). Cells were lysed and total protein was analyzed for phosphorylated NF-κB p65 (p-NF-κB) and expressed as relative to control cells at 1 h (B) or at start of incubation (C). Data is presented as mean ± s.d. Asterisks (*) indicate a significant difference (p < 0.05) between TNFα-stimulated cells and control cells at each time point, and the hash symbols (#) indicate a significant difference (p < 0.05) between TNFα-stimulated cells and cells treated with TNFα together with Bay at each time point. (D) Gingival fibroblast were cultured with the indicated doses of Bay in the absence or presence of TNFα (20 ng/ml) for 24 h. Levels of PGE2 in the culture media were measured by EIA on a Luminex system, and data is presented as mean ± s.d. Asterisks (*) indicate a significant difference from control cells not treated with TNFα or Bay (p < 0.05). (E) Gingival fibroblast were cultured with Bay (2 μM) in the absence or presence of TNFα (20 ng/ml) for 6 h. Levels of PGE2 in the culture media were measured by EIA, and data is presented as mean ± s.d. Asterisk (*) indicates a significant difference (p < 0.05). The results are representative for all three cell lines and all analyses were performed in triplicates.
Figure 8
Figure 8
Inhibition of Nuclear Factor-kappaB (NF-κB) by Ro 106-9920 decreases mPGES-1 and COX-2 expression. (A) Gingival fibroblasts were treated with TNFα (20 ng/ml) with or without the NF-κB activation inhibitor Ro 106-9920 (Ro, 4.0 μM) for 24 h. Expression of mPGES-1 and COX-2 was measured by flow cytometry using specific antibodies. (B) Gingival fibroblast were cultured with Ro (4.0 μM) in the absence or presence of TNFα (20 ng/ml) for 24 h. Levels of PGE2 in the culture media were measured by EIA, and data is presented as mean ± s.d. Asterisk (*) indicates a significant difference compared to control cells not treated with TNFα or Ro, and the hash symbol (#) indicates a significant difference compared to cells treated with TNFα only (p < 0.05). The results are representative for all three cell lines and all analyses were performed in triplicates.

Similar articles

Cited by

References

    1. Bascones A, Noronha S, Gomez M, Mota P, Gonzalez Moles MA, Dorrego MV. Tissue destruction in periodontitis: bacteria or cytokines fault? Quintessence Int. 2005;36:299–306. - PubMed
    1. Page RC, Offenbacher S, Schroeder HE, Seymour GJ, Kornman KS. Advances in the pathogenesis of periodontitis: summary of developments, clinical implications and future directions. Periodontol 2000. 1997;14:216–248. doi: 10.1111/j.1600-0757.1997.tb00199.x. - DOI - PubMed
    1. Pihlstrom BL, Michalowicz BS, Johnson NW. Periodontal diseases. Lancet. 2005;366:1809–1820. doi: 10.1016/S0140-6736(05)67728-8. - DOI - PubMed
    1. Yucel-Lindberg T, Nilsson S, Modeer T. Signal transduction pathways involved in the synergistic stimulation of prostaglandin production by interleukin-1beta and tumor necrosis factor alpha in human gingival fibroblasts. J Dent Res. 1999;78:61–68. doi: 10.1177/00220345990780010901. - DOI - PubMed
    1. Noguchi K, Ishikawa I. The roles of cyclooxygenase-2 and prostaglandin E2 in periodontal disease. Periodontol 2000. 2007;43:85–101. doi: 10.1111/j.1600-0757.2006.00170.x. - DOI - PubMed

Publication types

MeSH terms