

Gradient-echo magnetic resonance imaging study of pancreatic iron overload in young Egyptian beta-thalassemia major patients and effect of splenectomy
- PMID: 20398341
- PMCID: PMC2873247
- DOI: 10.1186/1758-5996-2-23
Gradient-echo magnetic resonance imaging study of pancreatic iron overload in young Egyptian beta-thalassemia major patients and effect of splenectomy
Abstract
Background: Thalassemic patients suffer from diabetes mellitus secondary to hemosiderosis.
Aims: The study aimed to evaluate pancreatic iron overload by T2*-weighted Gradient-echo magnetic resonance imaging (MRI) in young beta-thalassemia major patients and to correlate it with glucose disturbances, hepatic hemosiderosis, serum ferritin and splenectomy.
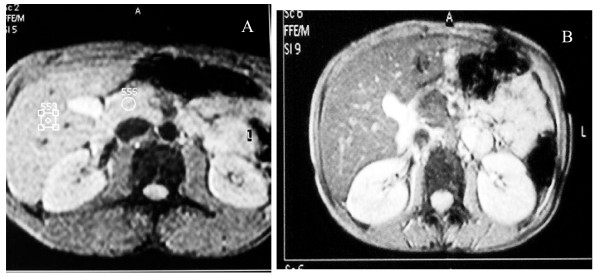
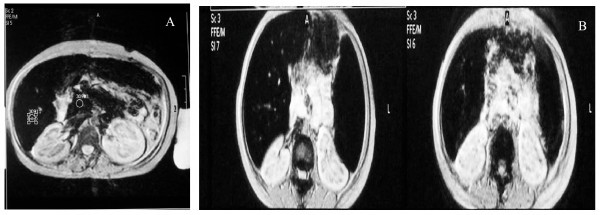
Methods: Forty thalassemic patients (20 non diabetic, 10 diabetic, and 10 with impaired glucose tolerance) were recruited from Pediatric Hematology Clinic, in addition to 20 healthy controls. All patients underwent clinical assessment and laboratory investigations included complete blood count, liver function tests, serum ferritin and oral glucose tolerance test (OGTT). A T2*-weighted gradient-echo sequence MRI was performed with 1.5 T scanner and signal intensity ratio (SIR) of the liver and the pancreas to noise were calculated.
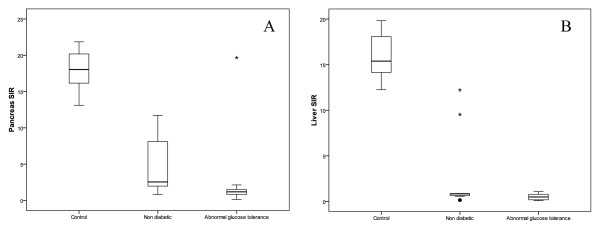
Results: Significant reduction in signal intensity ratio (SIR) of the liver and the pancreas was shown in thalassemic patients compared to controls (P < 0.0001), Thalassemic patients with abnormal glucose tolerance; including diabetics and thalassemics with impaired glucose tolerance; displayed a higher degree of pancreatic and hepatic siderosis compared to thalassemics with normal glucose tolerance or controls (P < 0.001, P < 0.0001). Splenectomized thalassemic patients had significantly lower SIR of pancreas compared to non splenectomized patients (P < 0.05). A strong correlation was present between hepatic and pancreatic siderosis in studied patients (P < 0.001).
Conclusions: pancreatic siderosis can be detected by T2* gradient-echo MRI since childhood in thalassemic patients, and is more evident in patients with abnormal glucose tolerance. After splenectomy, iron deposition may be accelerated in the pancreas. Follow up of thalassemic patients using pancreatic MRI together with intensive chelation therapy may help to prevent the development of overt diabetes.
Figures
Similar articles
-
Assessment of hepatic and pancreatic iron overload in pediatric Beta-thalassemic major patients by t2* weighted gradient echo magnetic resonance imaging.ISRN Hematol. 2013 Mar 28;2013:496985. doi: 10.1155/2013/496985. Print 2013. ISRN Hematol. 2013. PMID: 23606980 Free PMC article.
-
Correlation of Pancreatic Iron Overload Measured by T2*-Weighted Magnetic Resonance Imaging in Diabetic Patients with β-Thalassemia Major.Hemoglobin. 2017 May;41(3):151-156. doi: 10.1080/03630269.2017.1340306. Epub 2017 Aug 1. Hemoglobin. 2017. PMID: 28762844
-
Pancreatic iron stores assessed by magnetic resonance imaging (MRI) in beta thalassemic patients.Eur J Radiol. 2012 Jul;81(7):1465-70. doi: 10.1016/j.ejrad.2011.03.077. Epub 2011 Apr 17. Eur J Radiol. 2012. PMID: 21501938
-
Abnormal glucose tolerance in Egyptian beta-thalassemic patients: possible association with genotyping.Pediatr Diabetes. 2004 Sep;5(3):126-32. doi: 10.1111/j.1399-543X.2004.00051.x. Pediatr Diabetes. 2004. PMID: 15450007
-
T2* Magnetic Resonance Imaging Study of Pancreatic Iron Overload and its Relation With the Diabetic State in Thalassemic Patients.J Pediatr Hematol Oncol. 2017 Jul;39(5):337-340. doi: 10.1097/MPH.0000000000000767. J Pediatr Hematol Oncol. 2017. PMID: 28085743
Cited by
-
Assessment of glucose homeostasis in young adult female β-thalassemia major patients (β-TM) with acquired hypogonadotropic hypogonadism (AHH) never treated with sex steroids compared to eugonadal β-TM patients with spontaneous menstrual cycles.Acta Biomed. 2023 Jun 14;94(3):e2023065. doi: 10.23750/abm.v94i3.14147. Acta Biomed. 2023. PMID: 37326269 Free PMC article.
-
The effect of zinc deficiency and iron overload on endocrine and exocrine pancreatic function in children with transfusion-dependent thalassemia: a cross-sectional study.BMC Pediatr. 2021 Oct 22;21(1):468. doi: 10.1186/s12887-021-02940-5. BMC Pediatr. 2021. PMID: 34686155 Free PMC article.
-
Assessment of hepatic and pancreatic iron overload in pediatric Beta-thalassemic major patients by t2* weighted gradient echo magnetic resonance imaging.ISRN Hematol. 2013 Mar 28;2013:496985. doi: 10.1155/2013/496985. Print 2013. ISRN Hematol. 2013. PMID: 23606980 Free PMC article.
-
A prospective guide for clinical implementation of selected OGTT- derived surrogate indices for the evaluation of β- cell function and insulin sensitivity in patients with transfusion-dependent β- thalassaemia.Acta Biomed. 2023 Dec 5;94(6):e2023221. doi: 10.23750/abm.v94i6.15329. Acta Biomed. 2023. PMID: 38054665 Free PMC article.
-
The effects of excess weight on glucose homeostasis in young adult females with β-thalassemia major (β-TM): a preliminary retrospective study.Acta Biomed. 2023 Oct 17;94(5):e2023225. doi: 10.23750/abm.v94i6.14909. Acta Biomed. 2023. PMID: 37850764 Free PMC article.
References
-
- Kattamis C, Ladis V, Tsoussis D, Kaloumenou I, Theodoridis C. Evolution of glucose intolerance and diabetes in transfused patients with thalassemia. Pediatr Endocrinol Rev. 2004;2 Suppl 2:267–271. - PubMed
-
- Li CK, Luk CW, Ling SC, Chik KW, Yuen HL, Li CK, Shing MM, Chang KO, Yuen PM. Morbidity and mortality patterns of thalassaemia major patients in Hong Kong: retrospective study. Hong Kong Med J. 2002;8(4):255–60. - PubMed
-
- De Sanctis V, Eleftheriou A, Malaventura C. Prevalence of endocrine complications and short stature in patients with thalassaemia major: a multicenter study by the Thalassaemia International Federation (TIF) Pediatr Endocrinol Rev. 2004;2(Suppl 2):249–55. - PubMed
-
- Cario H, Holl RW, Debatin M, Kohne E. Insulin sensitivity and beta cell secretion in thalassaemia major with secondary hemochromatosis: assessment by oral glucose tolerance test. Eur J Pediatr. 2003;162(3):139–46. - PubMed
LinkOut - more resources
Full Text Sources
