. 2010 Apr 17:11:245.
doi: 10.1186/1471-2164-11-245.

A genome-wide survey of sRNAs in the symbiotic nitrogen-fixing alpha-proteobacterium Sinorhizobium meliloti

Affiliations

A genome-wide survey of sRNAs in the symbiotic nitrogen-fixing alpha-proteobacterium Sinorhizobium meliloti

Jan-Philip Schlüter et al. BMC Genomics. .

Abstract

Background: Small untranslated RNAs (sRNAs) are widespread regulators of gene expression in bacteria. This study reports on a comprehensive screen for sRNAs in the symbiotic nitrogen-fixing alpha-proteobacterium Sinorhizobium meliloti applying deep sequencing of cDNAs and microarray hybridizations.

Results: A total of 1,125 sRNA candidates that were classified as trans-encoded sRNAs (173), cis-encoded antisense sRNAs (117), mRNA leader transcripts (379), and sense sRNAs overlapping coding regions (456) were identified in a size range of 50 to 348 nucleotides. Among these were transcripts corresponding to 82 previously reported sRNA candidates. Enrichment for RNAs with primary 5'-ends prior to sequencing of cDNAs suggested transcriptional start sites corresponding to 466 predicted sRNA regions. The consensus sigma70 promoter motif CTTGAC-N17-CTATAT was found upstream of 101 sRNA candidates. Expression patterns derived from microarray hybridizations provided further information on conditions of expression of a number of sRNA candidates. Furthermore, GenBank, EMBL, DDBJ, PDB, and Rfam databases were searched for homologs of the sRNA candidates identified in this study. Searching Rfam family models with over 1,000 sRNA candidates, re-discovered only those sequences from S. meliloti already known and stored in Rfam, whereas BLAST searches suggested a number of homologs in related alpha-proteobacteria.

Conclusions: The screening data suggests that in S. meliloti about 3% of the genes encode trans-encoded sRNAs and about 2% antisense transcripts. Thus, this first comprehensive screen for sRNAs applying deep sequencing in an alpha-proteobacterium shows that sRNAs also occur in high number in this group of bacteria.


Figures

Figure 1
Figure 1
Experimental procedures for non-coding sRNA identification. (a) Sample preparation for deep sequencing with GS FLX: Sample 1 is enriched for primary transcripts. Treatment 1: Terminator Phosphate Dependent Exonuclease (TPE) was used to eliminate processed transcripts. Treatment 2: Tobacco Acid Pyrophosphatase (TAP) was used to eliminate pyrophosphates from primary transcripts. Sample 2 is enriched for processed transcripts. (b) Sample preparation for deep sequencing with Genome Analyzer II. (c) Sample labeling and hybridization for microarray-based screening. (d) Sample preparation for Affymetrix Symbiosis Chip-based screening.
Figure 2
Figure 2
Relative proportion of sRNA candidates in different classes. (a) 454 sequencing: distribution of reads mapped to the S. meliloti 1021 genome and distribution of the analyzed contigs according to the general classification (Figure 3). Left circle diagram: light colored (I) and colored (II), number of reads derived from sample 1 and 2. Reads in sample 1 and 2: non-mapped, 48,159 and 57,964; rRNA genes, 67,891 and 176,848; tRNA genes, 188,121 and 79,789; repeats, 3,029 and 6,206; IGRs or ORFs, 77,326 and 140,702. Right circle diagram: light colored (I), colored (II) and dark colored (I+II) represent the number of RNA candidates derived from sample 1, sample 2, and both samples, respectively: trans-encoded sRNAs, 28, 38, 85; cis-encoded antisense sRNAs, 9, 52, 35; mRNA leader transcripts, 46, 151, 181; sense sRNAs 28, 363, 56; ORFs 0, 4, 4. (b) Illumina/Solexa sequencing: Distribution of reads mapped to the S. meliloti 1021 genome. Reads: non-mapped, 1,179,722; rRNA genes, 3,405,289; tRNA genes, 1,058,534; repeats, 111,355; IGR and ORFs, 711,851. Dark green segment: contigs for 44 putative trans-encoded sRNAs. (c) Microarray-based analysis and (d) Affymetrix Symbiosis Chip-based analysis: distribution of sRNA candidates. Segment numbers represent subtypes. Microarray data: type 1 and 2 trans-encoded sRNAs, 264 and 721 candidates; type 1, 2 and 3 cis-encoded antisense sRNAs, 25, 587 and 59; mRNA leader transcripts, 250. Affymetrix Symbiosis Chip data: type 1 and 2 trans-encoded sRNAs, 60 and 174; type 1, 2 and 3 cis-encoded antisense sRNAs, 3, 4 and 27; mRNA leader, 112.
Figure 3
Figure 3
Classification of 454 contigs. Contig classification is based on a model of a minimal transcription unit. RBS, ribosomal binding site. Five classes were defined: (a) trans-encoded sRNAs are located at least 60 nt upstream and 20 nt downstream from the translation start and stop codons, respectively. Type 1 is located antisense to both adjacent genes, type 2 sRNAs are flanked by at least one adjacent gene in the same orientation. (b) Cis-encoded antisense sRNA in the opposite direction of the minimal transcription unit grouped into type 1-3 depending on the relative location to the associated gene. Type 1, 2 and 3 are located antisense to the 5'-UTR, to the coding region and to the 3'-UTR, respectively. (c) mRNA leader sequences either overlap the 40 nucleotides upstream of the minimal transcription unit or starting between position -40 and +1. The 3'-end of each contig is located inside the open reading frame (dashed line). (d) A sense sRNA is located in the same direction as the minimal transcription unit and assigned to one of four subclasses: type 1, 2, 3 and 4 overlaps the 5'-UTR, is located inside the ORF, overlaps the 3'-UTR, and starts inside the 3'-UTR, respectively. (e) Open reading frame: A contig that overlaps the whole ORF. The boxes highlighted in grey indicate classes used for classification of candidates derived from the microarray- and Affymetrix Symbiosis Chip-based screenings.
Figure 4
Figure 4
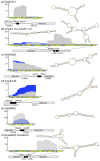
Examples of sequence profiles and secondary structures of full length trans-encoded sRNAs with common 5'- and 3'-end features. Sequence coverage profile: blue and light grey color denote transcript coverages derived from sample 1 and 2, respectively. Dark grey colored areas represent an overlap of coverages from both samples. y- and x-axis represent coverage and sequence, respectively. Sequence code: blue, A; yellow, C; orange, G; green, U. Grey arrows represent genes flanking or overlapping sRNA genes. Black arrows represent the sRNAs. (a) Trans-encoded sRNA SmelC411, two distinct 5'-ends and one distinct 3'-end; (b)trans-encoded sRNA SmelC111a and cis-encoded mRNA leader SmelB111b; three and two distinct 5'-ends, as well as one distinct and a variable 3'-end, respectively; (c) trans-encoded sRNA SmelA066, one distinct 5'- and a variable 3'-end; (d) type 3 cis-encoded antisense sRNA SmelC520, one distinct 5'-end and a variable 3'-end; (e) type 1 cis-encoded antisense sRNA SmelB062, two distinct 5'- and a variable 3'-end; (f) type 2 and type 1/3 cis-encoded antisense sRNAs: SmelA009, one distinct 5'-end and a variable 3'-end; SmelA010, several 5'- and 3'-ends.
Figure 5
Figure 5
Genome distribution of sRNA candidates on the chromosome. sRNA candidates are blotted at their genome position. The outer to inner circles show: 1 and 2, protein-encoding genes on the plus and minus strand, respectively; 3 and 4, trans-encoded sRNAs on the plus and minus strand, respectively; 5 and 6, cis-encoded antisense sRNAs on the plus and minus strand, respectively; 7 and 8, sense sRNAs on the plus and minus strand, respectively; 9 and 10, leader mRNA sequences on the plus and minus strand, respectively; 11 and 12, GC plot and GC skew, respectively.
Figure 6
Figure 6
Genome distribution of sRNA candidates on pSymA. sRNA candidates are blotted at their genome position. Outer to inner circles: see legend to Figure 5.
Figure 7
Figure 7
Genome distribution of sRNA candidates on pSymB. sRNA candidates are blotted at their genome position. Outer to inner circles: see legend to Figure 5.
Figure 8
Figure 8
sRNA length distribution. (a) The box and whisker plot diagram represents the minimum and maximum size, the median as well as the average sizes of the four defined sRNA classes. The sizes of the middle 50% of each candidate population are represented by the lower and upper quartile, respectively. (b) The histograms represent the complete length distribution of each individual class.
Figure 9
Figure 9
Examples of sRNAs within transposable elements. Sequence coverage profile: blue and light grey color denote transcript coverages derived from sample 1 and 2, respectively. Dark grey colored areas represent an overlap of coverages from both samples. y- and x-axis represent coverage and sequence, respectively. Sequence code: blue, A; yellow, C; orange, G; green, U. Grey arrows represent genes flanking or overlapping sRNA genes. Black arrows represent the sRNAs. (a) SmelA116 (mRNA leader transcript of SMa0861), (b) SmelB178 (antisense transcript of SMb20665).
Figure 10
Figure 10
Expression pattern of sequenced non-coding transcripts. Expression pattern of (a) trans-encoded sRNA, (b) cis-encoded antisense sRNAs and (c) mRNA leader transcripts identified by deep sequencing: log, stat, heat, cold, acidic, basic, oxidative represent the analyzed stress conditions. Grey, white and green boxes indicate no signal, weak signal (less than 8-fold) and strong signal (≥ 8-fold), respectively. * indicates candidates uniquely identified with Illumina/Solexa sequencing.
Figure 11
Figure 11
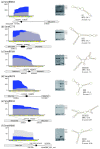
sRNA candidates validated by Northern hybridizations and 5'-RACE. Sequence coverage profile: blue and light grey color denote transcript coverages derived from sample 1 and 2, respectively. Dark grey colored areas represent an overlap of coverages from both samples. y- and x-axis represent coverage and sequence, respectively. Sequence code: blue, A; yellow, C; orange, G; green, U. Grey arrows represent genes flanking or overlapping sRNA genes. Black arrows represent the sRNAs. MFE: minimum free energy within the shape class. Validated by Northern hybridizations: trans-encoded sRNAs SmelB064 (a) and SmelC775 (b). Validated by 5'-RACE: trans-encoded sRNAs SmelB169 (c), SmelA075 (d), SmelB032 (e), SmelA060 (two copies in the genome, second copy SmelA072) (f). Lanes: 1, TY (control for cold shock); 2, cold shock; 3, TY (control for heat shock); 4, heat shock; 5, GMX (control for salt chock); 6, salt shock.
Figure 12
Figure 12
sRNA candidates validated by 5'-RACE. Sequence coverage profile, grey arrows, black arrows: see legend to Figure 11. Validated by 5'-RACE: trans-encoded sRNAs SmelC549 (g), SmelB047 (h), SmelB044 (i), antisense sRNA SmelA036 (j), sense sRNA SmelB156 (k), and mRNA leader SmelA038 (l). Lanes: see legend to Figure 11.
Figure 13
Figure 13
Z score-distribution. Distribution of Z-scores for dominant shape probabilities in different classes of transcripts. Shape probabilities serve as a measure of the well-definedness of secondary structure, which is independent of GC content. See Methods for details of the Z-score computation. The same data are shown as box plots (indicating median, first quartiles and extremal points) and as histograms. A bias towards positive Z-scores, strongest for trans-encoded sRNAs, and almost zero for mRNA leader transcripts is seen.
Figure 14
Figure 14
Venn diagram comparing trans-encoded sRNA candidates identified by 454 sequencing, Illumina/Solexa sequencing, and microarray hybridizations. In some cases a sRNA region detected by one method overlaps with multiple regions detected by one or both of the other methods. This is indictated by the colors of the numbers in the fields representing the overlaps. Numbers in brackets indicate discrepancies in the classification of sRNA regions identified by different methods. Small numbers indicate 454 deep sequencing candidates not classified as trans-encoded sRNA.
Figure 15
Figure 15
ROSE elements, IncA antisense RNAs, and tmRNA identified by 454 sequencing. Sequence coverage profile: blue and light grey color denote transcript coverages derived from sample 1 and 2, respectively. Dark grey colored areas represent an overlap of coverages from both samples. y- and x-axis represent coverage and sequence, respectively. Sequence code: blue, A; yellow, C; orange, G; green, U. Grey arrows represent genes flanking or overlapping sRNA genes. Black arrows represent the sRNAs. (a) ibpA ROSE element (no ID), (b) SMb21295 ROSE element (SmelB085), (c) incA located on pSymA (SmelA103), (d) incA located on pSymB (SmelB006). (e) both fragments, SmelC524 and SmelC525 of the tmRNA.

Similar articles

Cited by

References

    1. Altuvia S. Identification of bacterial small non-coding RNAs: experimental approaches. Curr Opin Microbiol. 2007;10:257–261. doi: 10.1016/j.mib.2007.05.003. - DOI - PubMed
    1. Novick RP, Geisinger E. Quorum sensing in staphylococci. Annu Rev Genet. 2008;42:541–564. doi: 10.1146/annurev.genet.42.110807.091640. - DOI - PubMed
    1. Vogel J, Papenfort K. Small non-coding RNAs and the bacterial outer membrane. Curr Opin Microbiol. 2006;9:605–611. doi: 10.1016/j.mib.2006.10.006. - DOI - PubMed
    1. Brown S. Time of action of 4.5 S RNA in Escherichia coli translation. J Mol Biol. 1989;209:79–90. doi: 10.1016/0022-2836(89)90171-X. - DOI - PubMed
    1. Kazantsev AV, Pace NR. Bacterial RNase P: a new view of an ancient enzyme. Nat Rev Microbiol. 2006;4:729–740. doi: 10.1038/nrmicro1491. - DOI - PubMed

Publication types

MeSH terms