

The use of muscle strength assessed with handheld dynamometers as a non-invasive biological marker in myotonic dystrophy type 1 patients: a multicenter study
- PMID: 20398425
- PMCID: PMC2868792
- DOI: 10.1186/1471-2474-11-72
The use of muscle strength assessed with handheld dynamometers as a non-invasive biological marker in myotonic dystrophy type 1 patients: a multicenter study
Abstract
Background: Myotonic dystrophy type 1 (DM1) is a multisystem disorder that demonstrates variable symptoms and rates of progression. Muscle weakness is considered one of the main problems with a clinical picture that is characterized by distal weakness of the limbs progressing to proximal weakness. The main objective of this study was to characterize the maximal strength of ankle eversion and dorsiflexion in DM1 patients. Manual and handheld dynamometer (HHD) muscle testing were also compared.
Methods: The maximal strength of 22 patients from Quebec (mean age = 41,1 +/- 13,8) and 24 from Lyon (mean age = 41,6 +/- 10,2) were compared to 16 matched controls.
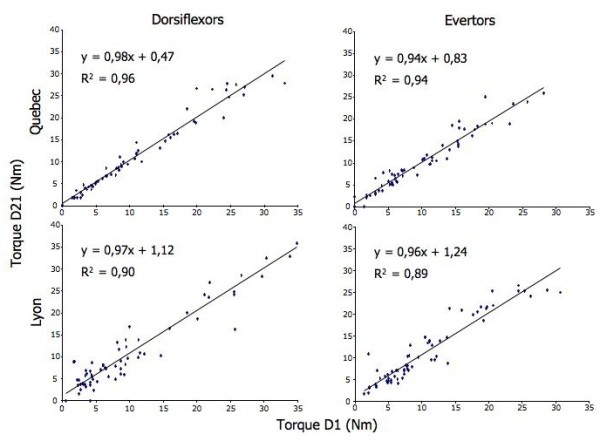
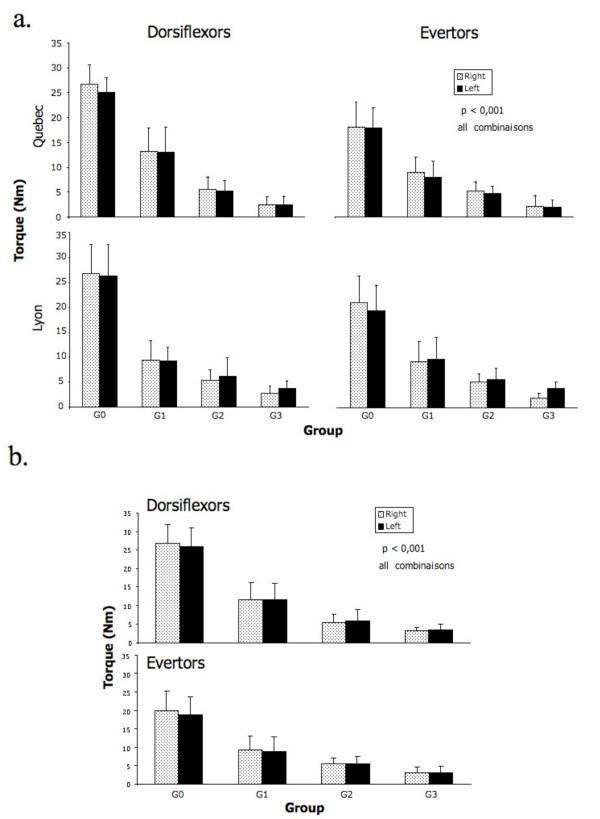
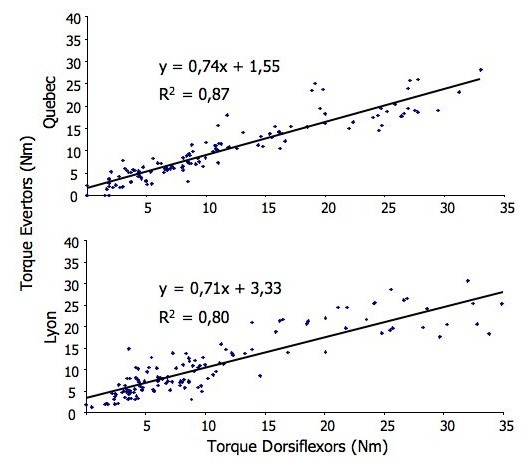
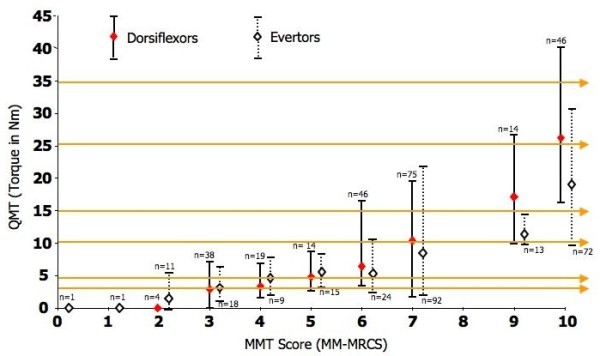
Results: With the use of HHD, an excellent reproducibility of the torque measurements was obtained for both centers in eversion (R2 = 0,94/Quebec; 0,89/Lyon) and dorsiflexion (R2 = 0,96/Quebec; 0,90/Lyon). The differences between 3 groups of DM1 (mild, moderate, severe) and between them and controls were all statistically significant (p < 0,001). No statistical differences between sites were observed (p > 0.05). The degree of muscle strength decline in dorsiflexion (eversion) were 60% (47%), 77% (71%), and 87% (83%) for DM1 with mild, moderate, and severe impairments, respectively. The smallest mean difference between all DM1 patients taking together was 2.3 Nm, a difference about twice than the standard error of measurement. There was a strong relationship between eversion and dorsiflexion strength profiles (R2 = 0,87;Quebec/0,80;Lyon). Using a 10-point scale, manual muscle testing could not discriminate between the 3 groups of DM1 patients.
Conclusions: The HHD protocol showed discriminative properties suitable for multicentre therapeutic trial. The present results confirmed the capacity of quantitative muscle testing to discriminate between healthy and DM1 patients with different levels of impairments. This study is a preliminary step for the implementation of a valid, reliable and responsive clinical outcome for the measurement of muscle impairments with this population.
Figures
Similar articles
-
Ankle Strength Impairments in Myotonic Dystrophy Type 1: A Five-Year Follow-up.J Neuromuscul Dis. 2018;5(3):321-330. doi: 10.3233/JND-180311. J Neuromuscul Dis. 2018. PMID: 29889079
-
Severity, type, and distribution of myotonic discharges are different in type 1 and type 2 myotonic dystrophy.Muscle Nerve. 2007 Apr;35(4):479-85. doi: 10.1002/mus.20722. Muscle Nerve. 2007. PMID: 17230537 Clinical Trial.
-
Responsiveness of outcome measures in myotonic dystrophy type 1.Ann Clin Transl Neurol. 2020 Aug;7(8):1382-1391. doi: 10.1002/acn3.51129. Epub 2020 Jul 16. Ann Clin Transl Neurol. 2020. PMID: 32672404 Free PMC article.
-
A review of muscle- and performance-based assessment instruments in DM1.Muscle Nerve. 2017 Jul;56(1):78-85. doi: 10.1002/mus.25468. Epub 2017 Mar 1. Muscle Nerve. 2017. PMID: 27862025 Review.
-
What is known about the effects of exercise or training to reduce skeletal muscle impairments of patients with myotonic dystrophy type 1? A scoping review.BMC Musculoskelet Disord. 2019 Mar 5;20(1):101. doi: 10.1186/s12891-019-2458-7. BMC Musculoskelet Disord. 2019. PMID: 30836978 Free PMC article.
Cited by
-
Tamoxifen in Duchenne muscular dystrophy (TAMDMD): study protocol for a multicenter, randomized, placebo-controlled, double-blind phase 3 trial.Trials. 2019 Nov 21;20(1):637. doi: 10.1186/s13063-019-3740-6. Trials. 2019. PMID: 31752977 Free PMC article.
-
Interrater and Intrarater Reliability of the EasyForce Dynamometer for Assessment of Maximal Shoulder, Knee and Hip Strength.Diagnostics (Basel). 2022 Feb 9;12(2):442. doi: 10.3390/diagnostics12020442. Diagnostics (Basel). 2022. PMID: 35204532 Free PMC article.
-
Hand-Held Dynamometry Isometric Torque Reference Values for Children and Adolescents.Pediatr Phys Ther. 2015 Winter;27(4):414-23. doi: 10.1097/PEP.0000000000000179. Pediatr Phys Ther. 2015. PMID: 26397089 Free PMC article.
-
THE INFLUENCE OF SENSORIMOTOR TRAINING MODALITIES ON BALANCE, STRENGTH, JOINT FUNCTION, AND PLANTAR FOOT SENSITIVITY IN RECREATIONAL ATHLETES WITH A HISTORY OF ANKLE SPRAIN: A RANDOMIZED CONTROLLED PILOT STUDY.Int J Sports Phys Ther. 2018 Dec;13(6):993-1007. Int J Sports Phys Ther. 2018. PMID: 30534465 Free PMC article.
-
Reliability of Muscle Strength and Muscle Power Assessments Using Isokinetic Dynamometry in Neuromuscular Diseases: A Systematic Review.Phys Ther. 2022 Oct 6;102(10):pzac099. doi: 10.1093/ptj/pzac099. Phys Ther. 2022. PMID: 35899532 Free PMC article.
References
-
- Harper PS. Myotonic Dystrophy. 3. London: W.B. Saunders; 2001.
-
- Mathieu J, Boivin H, Richards CL. Quantitative motor assessment in myotonic dystrophy. Can J Neurology. 2003;30:129–136. - PubMed
-
- Johnson ER, Abresch RT, Carter GT, Kilmer DD, Fowler WM Jr, Sigford BJ, Wanlass RL. Profiles of neuromuscular diseases. Myotonic Dystrophy. Am J Phys Med Rehabil. 1995;74(5 Suppl):S104–S116. - PubMed
-
- Mathieu J, Boivin H, Meunier M, Bégin P. Assessment of a disease-specific muscular impairment rating scale in myotonic dystrophy. Neurology. 2001;56:336–340. - PubMed
Publication types
MeSH terms
Substances
LinkOut - more resources
Full Text Sources
Other Literature Sources
