

Clustering of large cell populations: method and application to the basal forebrain cholinergic system
- PMID: 20398701
- PMCID: PMC2932822
- DOI: 10.1016/j.jneumeth.2010.04.008
Clustering of large cell populations: method and application to the basal forebrain cholinergic system
Abstract
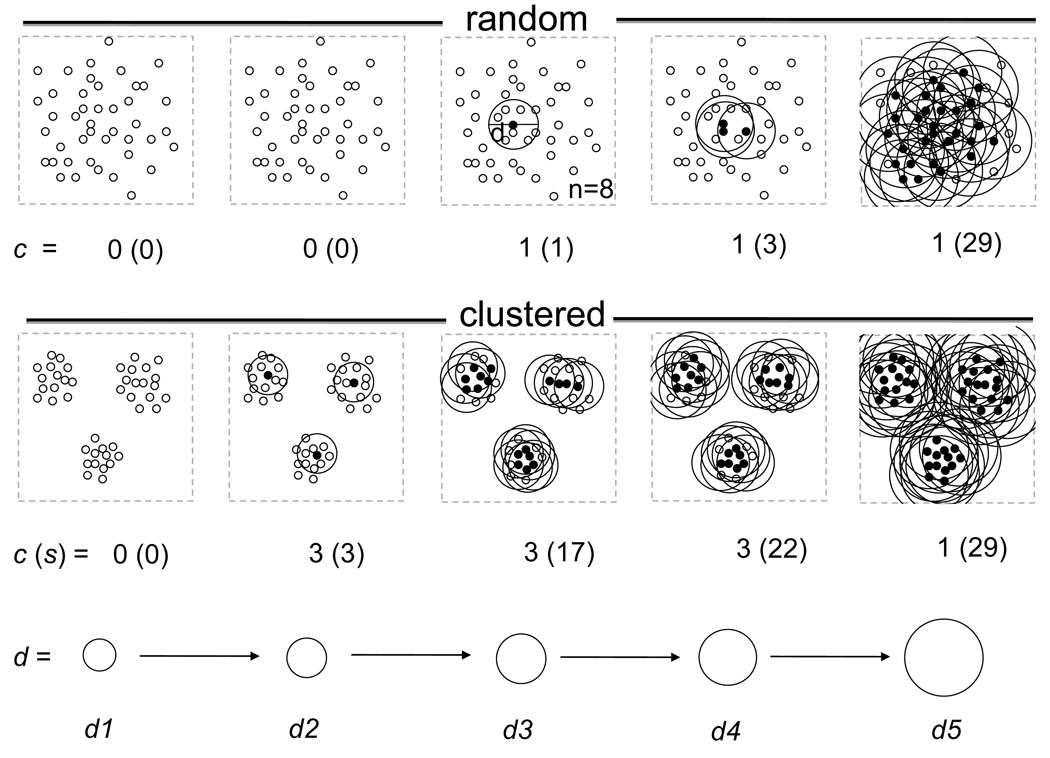
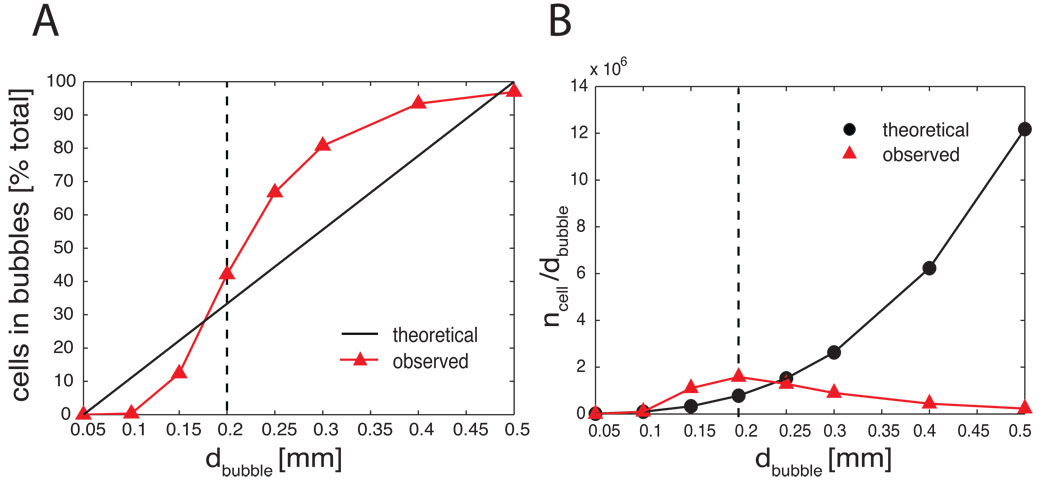
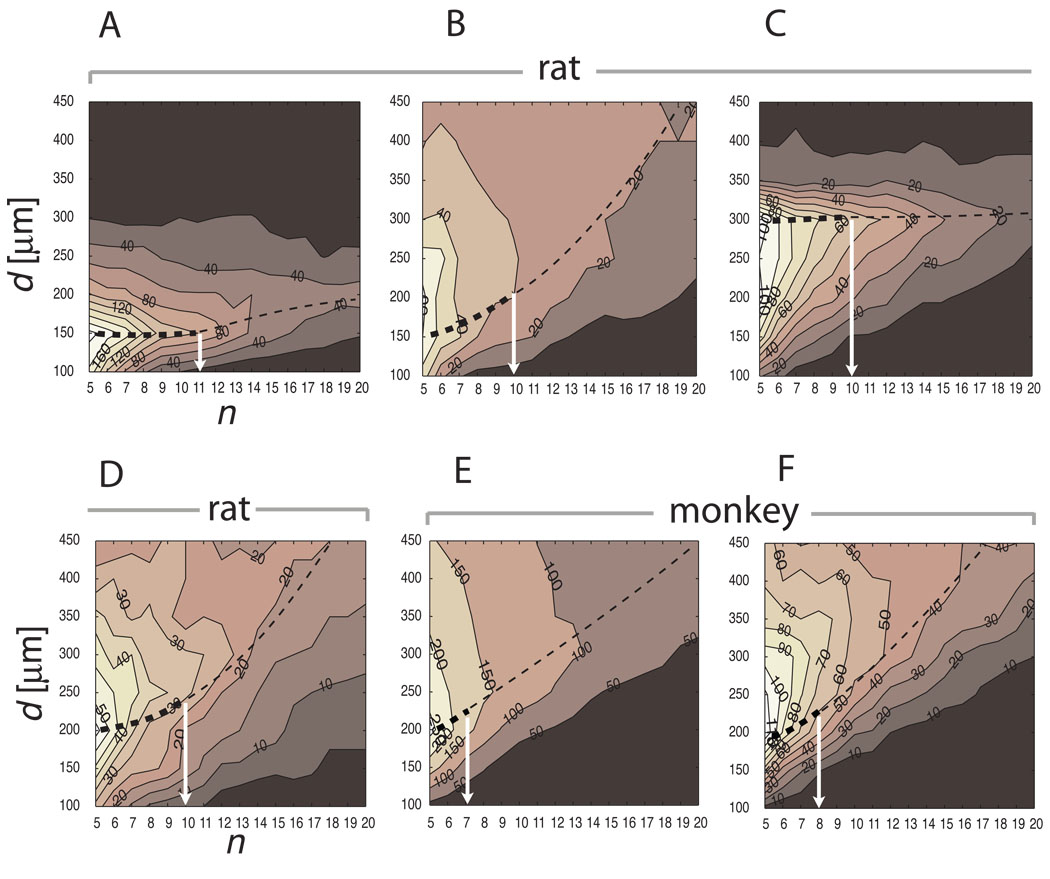
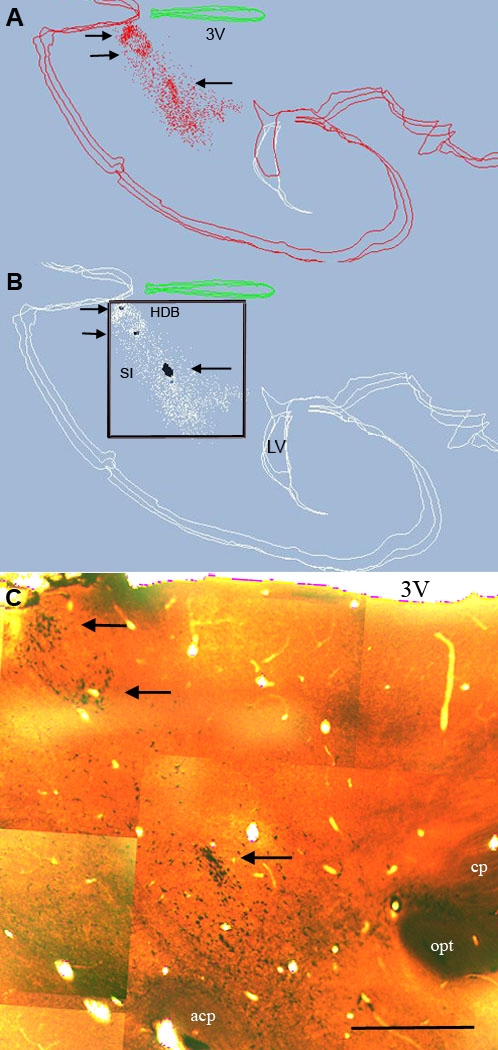
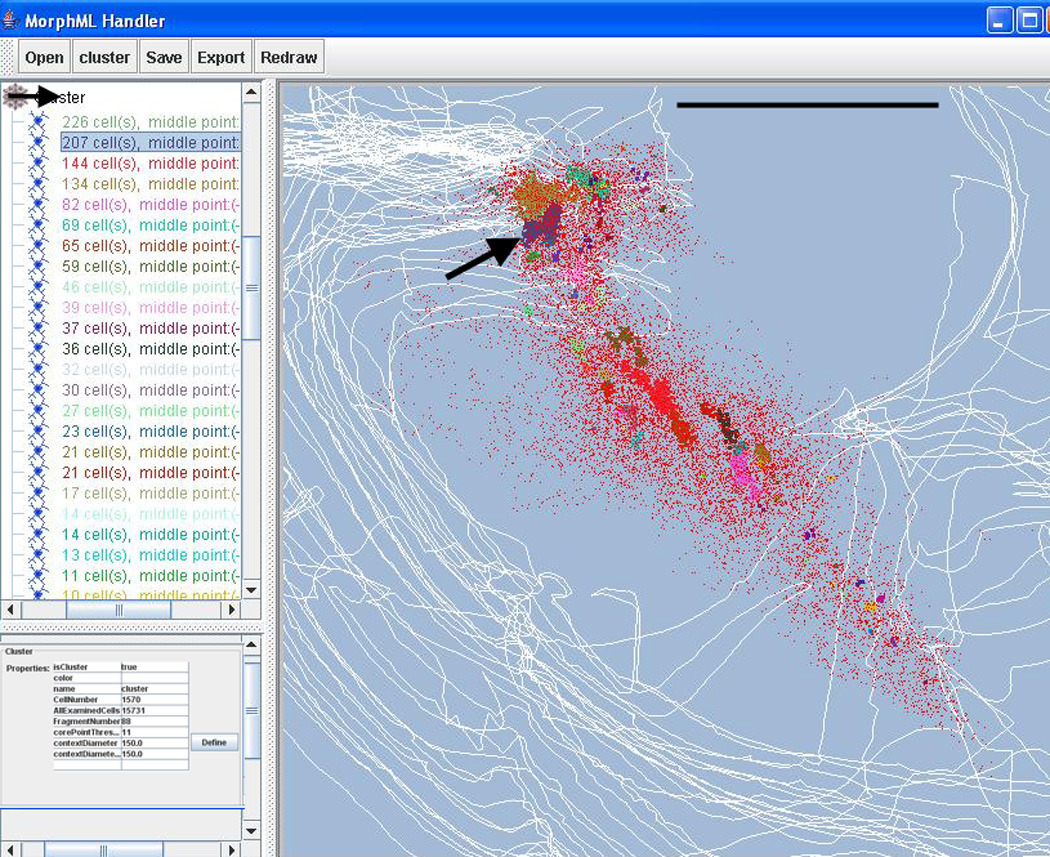
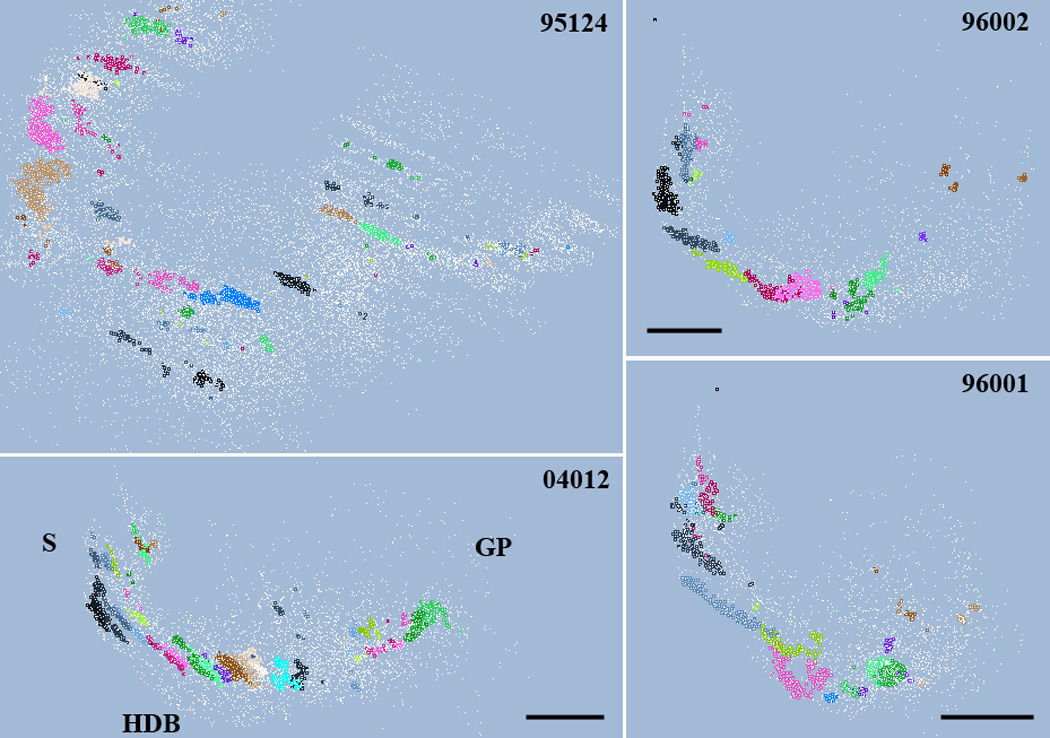
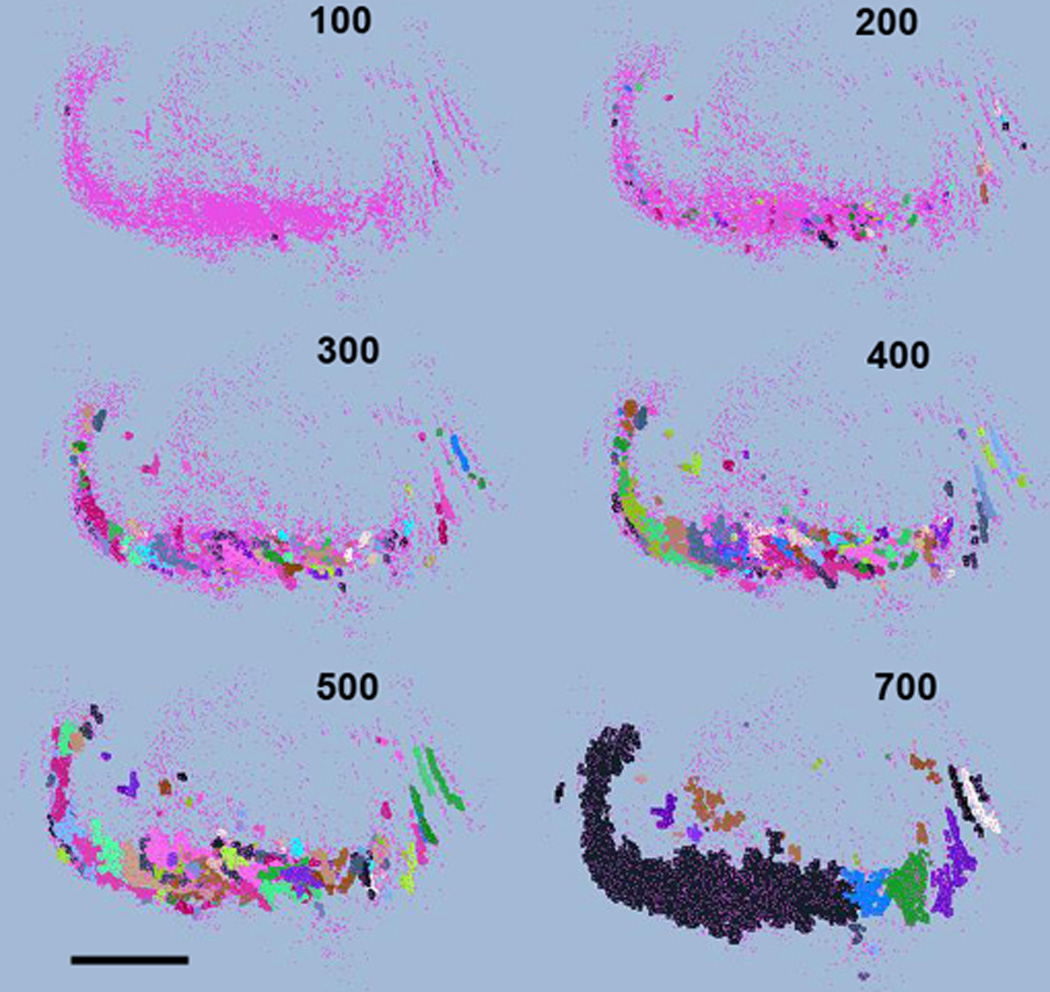
Functionally related groups of neurons spatially cluster together in the brain. To detect groups of functionally related neurons from 3D histological data, we developed an objective clustering method that provides a description of detected cell clusters that is quantitative and amenable to visual exploration. This method is based on bubble clustering (Gupta and Ghosh, 2008). Our implementation consists of three steps: (i) an initial data exploration for scanning the clustering parameter space; (ii) determination of the optimal clustering parameters; and (iii) final clustering. We designed this algorithm to flexibly detect clusters without assumptions about the underlying cell distribution within a cluster or the number and sizes of clusters. We implemented the clustering function as an integral part of the neuroanatomical data visualization software Virtual RatBrain (http://www.virtualratbrain.org). We applied this algorithm to the basal forebrain cholinergic system, which consists of a diffuse but inhomogeneous population of neurons (Zaborszky, 1992). With this clustering method, we confirmed the inhomogeneity in this system, defined cell clusters, quantified and localized them, and determined the cell density within clusters. Furthermore, by applying the clustering method to multiple specimens from both rat and monkey, we found that cholinergic clusters display remarkable cross-species preservation of cell density within clusters. This method is efficient not only for clustering cell body distributions but may also be used to study other distributed neuronal structural elements, including synapses, receptors, dendritic spines and molecular markers.
Copyright © 2010 Elsevier B.V. All rights reserved.
Figures
Similar articles
-
Amelioration of cholinergic neurons dysfunction in aged rats depends on the continuous supply of NGF.Neurobiol Aging. 2002 Jul-Aug;23(4):601-13. doi: 10.1016/s0197-4580(01)00345-1. Neurobiol Aging. 2002. PMID: 12009509
-
Distribution and organization of cholinergic neurons in the rat forebrain demonstrated by computer-aided data acquisition and three-dimensional reconstruction.J Comp Neurol. 1987 Sep 15;263(3):309-25. doi: 10.1002/cne.902630302. J Comp Neurol. 1987. PMID: 2822773
-
Three-dimensional chemoarchitecture of the basal forebrain: spatially specific association of cholinergic and calcium binding protein-containing neurons.Neuroscience. 2005;136(3):697-713. doi: 10.1016/j.neuroscience.2005.05.019. Neuroscience. 2005. PMID: 16344145 Free PMC article.
-
Local synaptic connections of basal forebrain neurons.Behav Brain Res. 2000 Nov;115(2):143-58. doi: 10.1016/s0166-4328(00)00255-2. Behav Brain Res. 2000. PMID: 11000417 Review.
-
Folic acid supplementation and malaria susceptibility and severity among people taking antifolate antimalarial drugs in endemic areas.Cochrane Database Syst Rev. 2022 Feb 1;2(2022):CD014217. doi: 10.1002/14651858.CD014217. Cochrane Database Syst Rev. 2022. PMID: 36321557 Free PMC article.
Cited by
-
Basal Forebrain Nuclei Display Distinct Projecting Pathways and Functional Circuits to Sensory Primary and Prefrontal Cortices in the Rat.Front Neuroanat. 2018 Aug 15;12:69. doi: 10.3389/fnana.2018.00069. eCollection 2018. Front Neuroanat. 2018. PMID: 30158859 Free PMC article.
-
Adult mouse basal forebrain harbors two distinct cholinergic populations defined by their electrophysiology.Front Behav Neurosci. 2012 May 8;6:21. doi: 10.3389/fnbeh.2012.00021. eCollection 2012. Front Behav Neurosci. 2012. PMID: 22586380 Free PMC article.
-
Neurons in the basal forebrain project to the cortex in a complex topographic organization that reflects corticocortical connectivity patterns: an experimental study based on retrograde tracing and 3D reconstruction.Cereb Cortex. 2015 Jan;25(1):118-37. doi: 10.1093/cercor/bht210. Epub 2013 Aug 19. Cereb Cortex. 2015. PMID: 23964066 Free PMC article.
-
Functional architecture of the forebrain cholinergic system in rodents.Res Sq [Preprint]. 2024 Jun 19:rs.3.rs-4504727. doi: 10.21203/rs.3.rs-4504727/v1. Res Sq. 2024. Update in: iScience. 2025 Feb 11;28(3):112001. doi: 10.1016/j.isci.2025.112001. PMID: 38947053 Free PMC article. Updated. Preprint.
-
Three-Dimensional Spatial Analyses of Cholinergic Neuronal Distributions Across The Mouse Septum, Nucleus Basalis, Globus Pallidus, Nucleus Accumbens, and Caudate-Putamen.Neuroinformatics. 2022 Oct;20(4):1121-1136. doi: 10.1007/s12021-022-09588-1. Epub 2022 Jul 6. Neuroinformatics. 2022. PMID: 35792992 Free PMC article.
References
-
- Bjaalie JG, Diggle PJ, Nikundiwe A, Karagulle T, Brodal P. Spatial segregation between populations of ponto-cerebellar neurons: Statistical analysis of multivariate interactions. Anat Rec. 1991;231:510–523. - PubMed
-
- Chevalier G, Mana S. Honeycomb-like structure of the intermediate layers of the rat superior colliculus, with additional observations in several other mammals: AChE patterning. J Comp Neurol. 2000;419:137–153. - PubMed
-
- Fox MD, Raichle ME. Spontaneous fluctuations in brain activity observed with functional magnetic resonance imaging. Nature Rev Neurosci. 2007;8:700–711. - PubMed
Publication types
MeSH terms
Grants and funding
LinkOut - more resources
Full Text Sources
