. 2010 Apr 27;20(8):687-96.
doi: 10.1016/j.cub.2010.03.024. Epub 2010 Apr 15.

Motor number controls cargo switching at actin-microtubule intersections in vitro

Affiliations

Motor number controls cargo switching at actin-microtubule intersections in vitro

Harry W Schroeder 3rd et al. Curr Biol. .

Abstract

Background: Cellular activities such as endocytosis and secretion require that cargos actively switch between the microtubule (MT) and actin filament (AF) networks. Cellular studies suggest that switching may involve a tug of war or coordinate regulation of MT- and AF-based motor function.

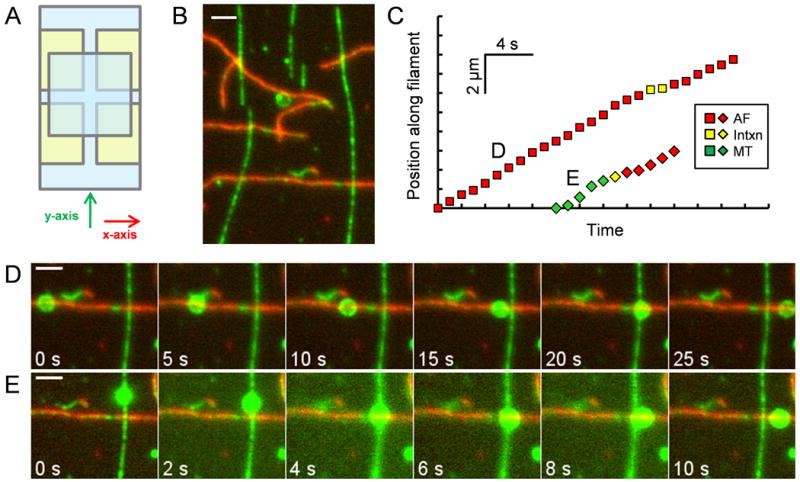
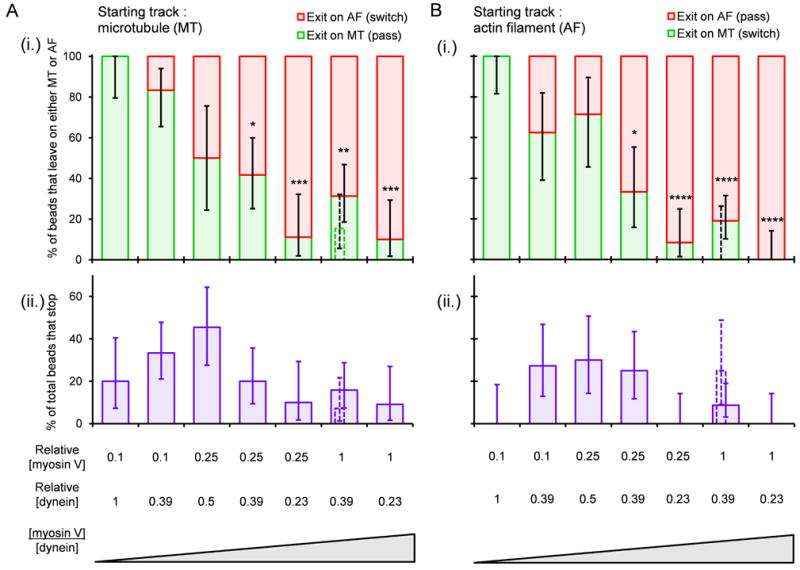
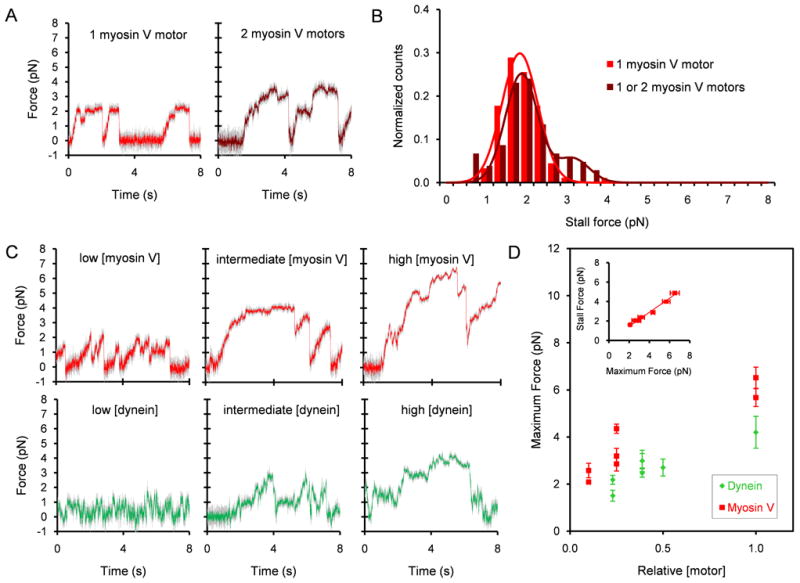
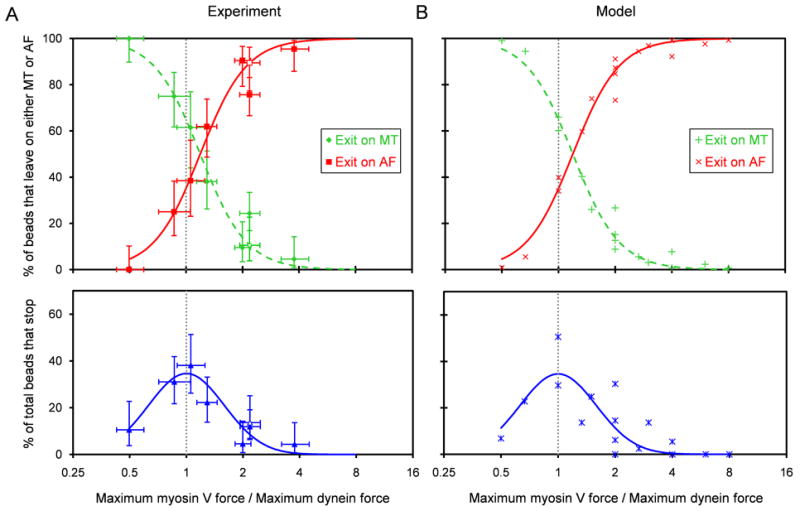
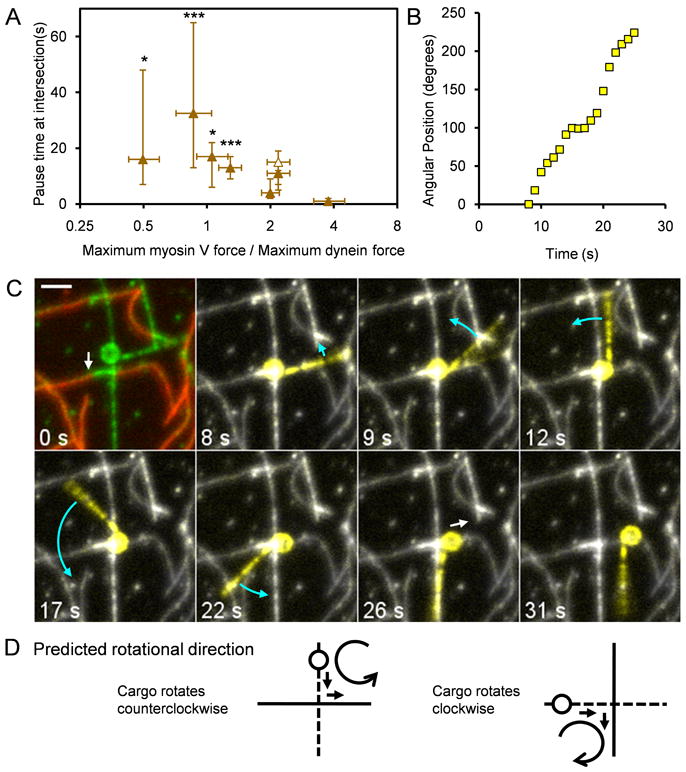
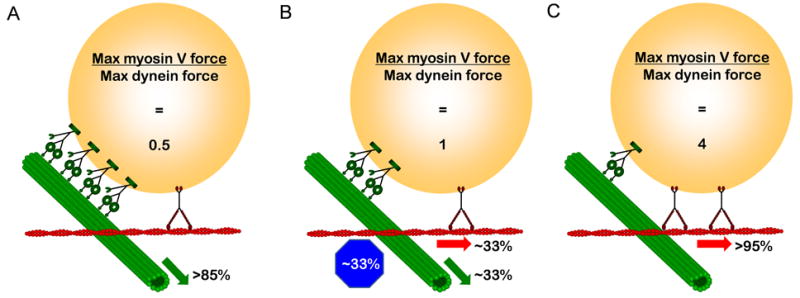
Results: To test the hypothesis that motor number can be used to direct the outcome of a tug-of-war process, we reconstituted cargo switching at MT-AF intersections in a minimal system with purified myosin V and dynein-dynactin motors bound to beads. Beads containing both motors often paused at the intersections and rotated about an axis perpendicular to both filaments, suggesting that competing motors apply a torque on their cargo. Force measurements showed that motor forces scale with the number of engaged myosin V and dynein-dynactin motors. Whether beads remained on a MT or AF or switched to the alternate track was determined by which set of motors collectively produced greater force. Passing and switching probabilities were similar whether the bead approached an intersection on either a MT or an AF. Beads with a force ratio near unity had approximately equal probabilities of exiting on the MT, exiting on the AF, or remaining stalled at the intersection. A simple statistical model quantitatively describes the relationship between switching probability and motor number.

Conclusions: Cargo switching can be tuned via combinations of 1-4 myosin V and 1-4 dynein-dynactin engaged motors through a simple force-mediated mechanism.


Figures

Figure 1
Figure 1
Crossed-flow-path sample chamber and representative time series of beads traversing intersections. (A) Four pieces of double-sided adhesive tape (yellow) hold two cover slips (blue) together to make two perpendicular (x and y) 3 mm wide flow paths. (B) Image of rhodamine-biotin-labeled microtubules and Alexa 647-rhodamine-biotin-labeled actin filaments bound to the cover slip of a crossed-path flow chamber. The microtubules (green) serve as “underpasses,” and actin filaments (red) serve as “overpasses.” The opposite geometry was also tested in some experiments. (C) Distance vs. time plot for the two beads shown in (D) and (E). Yellow symbols indicate pausing at the intersection. (D) Time series of a rhodamine-labeled bead that starts on an AF, encounters a MT, “passes,” and exits on the AF. (E) Time series of a bead that starts on a MT, “switches” at the intersection, and exits on an AF. Scale bars represent 2 μm. See also Movies S1 and S2.
Figure 2
Figure 2
Outcome following bead encounters with MT-AF intersections at different ratios of myosin V to dynein. (A) Outcome when bead enters the intersection along a MT. (B) Outcome when bead enters the intersection along an AF. In (A) and (B), panels (i) show the distributions of exits on AFs (red) and MTs (green) for those beads that did not stop at the intersections. Panels (ii) show the percentage of all beads that “stopped” (failed to leave intersection within ∼10 min). Loading concentrations of the motors, relative to a 7 nM myosin V stock and a 62 nM dynein stock, are shown below the bar plots. Wide solid bars represent the MT underpass, AF overpass geometry. Thin dotted bars represent the opposite geometry (MT overpass, AF underpass). Vertical error bars represent 68% confidence intervals calculated from binomial distributions. Numbers of total beads observed at each concentration ratio were between 8 and 23. Statistical significance was evaluated using Fisher's exact test with comparison to the lowest myosin V/dynein ratio: p<*0.05, **0.01, ***0.001, ****0.0001. See also Figure S1.
Figure 3
Figure 3
Force recordings. (A) Typical force traces, unfiltered (gray) and median filtered (red or brown, window size = 11 time points, i.e. 0.0055 s) for myosin V at two concentration ranges (0.0049 – 0.0070 nM, left panel) and 0.039 – 0.070 nM, right panel) in the absence of dynein. The trap stiffness was 0.022 pN/nm (left) and 0.040 pN/nm (right). (B) Histogram of myosin V stall force events in the absence of dynein for the same two loading concentration ranges. Only stall events that were followed by a snapback of the force trace to baseline were included. Left, n = 90 events, 11 beads; right n = 104 events, 16 beads. (C) Typical force traces, unfiltered (gray) and median filtered (red or green, window = 11), are shown for myosin V and dynein at the three loading concentrations for each motor (myosin V: low, intermediate, and high, 0.1, 0.25, and 1, respectively relative to 7 nM; dynein: 0.23, 0.39 or 0.5, and 1, respectively relative to 62 nM). The trap stiffness was 0.024 – 0.029 pN/nm. (D) Maximum force exhibited by beads coated with both myosin V and dynein versus relative loading concentrations. Each data point represents the average maximum force produced per bead in a median filtered (window = 201) force trace lasting typically 50 s. 4 – 10 beads were used for the myosin V data points and 8 - 13 beads for the dynein data points. (inset plot) Myosin V stall force exhibited by the same group of beads coated with both myosin V and dynein versus the myosin V maximum force. Only stall events that were preceded by a >36 nm displacement in the force trace away from the baseline due to motor stepping and followed by a snapback of the force trace >36 nm were used. Stall force events were pooled from multiple force traces and then averaged to obtain the population mean. Maximum and stall force measurements are plotted as mean ± SEM for 37 – 112 stall events for 4 – 9 beads. See also Figure S2.
Figure 4
Figure 4
Outcomes following encounters with intersections as a function of the myosin V:dynein maximum force ratio. (A top) For beads that exited the intersections, the percentages exiting on the MT (green), and on the AF (red) are plotted versus the ratio of myosin V and dynein maximum forces from Figure 3D. (A bottom) Percentages of total beads that stopped (blue). From Figure 2, data from MT and AF starting tracks are combined here. Closed symbols represent the MT underpass, AF overpass geometry; open symbols represent the opposite geometry. Vertical error bars represent 68% confidence intervals calculated from binomial distributions. Horizontal error bars represent 68% confidence intervals of the force ratios. Note that the MT and AF exit curves cross and the “Stop” curve reaches a peak at a myosinV:dynein maximum force ratio near 1. (B) Intersection statistics versus the myosin V:dynein maximum force ratio based on the statistical model described in the text (adjustable parameters: pmyosin V=0.7 and pdynein=0.85). S-shaped and Gaussian curves fitted to the model points (see text) are plotted in both (A) and (B). Vertical gray dotted lines denote a maximum force ratio of 1. See also Figures S3 and S4.
Figure 5
Figure 5
Beads pause and rotate at MT-AF intersections. (A) Plot of the pause time at intersections versus the ratio of the myosin V and dynein forces from Figure 3D. The shortest pause times occurred at the largest myosin V:dynein maximum force ratio of 3.8. Pause times at force ratios below 2 were statistically different from the shortest group (Fisher's exact test, p<*0.05, ***0.001). Closed symbols represent the MT underpass, AF overpass geometry; open symbols, the opposite geometry. Measurements are plotted as median ± 68% confidence intervals calculated from binomial distributions. 13 – 37 beads were included in each point. (B) Angular position vs. time for a myosin V and dynein coated bead while paused at a MT-AF intersection. (C) Sequence of images of the same bead used for panel (B) undergoing rotation. The bead approached the intersection on a MT underpass, rotated at least 224° at the intersection as indicated by the rigidly attached MT fragment, and exited on an AF overpass. White and blue arrows denote predominantly translational and rotational movement, respectively. In the first image, green and red represent rhodamine (AF and MTs) and Alexa 647 fluorescence (AFs), respectively. In the subsequent images, the motile bead and attached MT were highlighted in yellow by displaying the difference between the median z-projection for the entire 100 s rhodamine fluorescence movie and the data of each frame. The scale bar represents 2 μm. (D) Schematic showing the predicted direction of rotation of a bead that approaches an intersection from an underpass (dotted line) and switches onto an overpass (solid line) based on the force vectors operating on the bead (arrows). See also Movies S3 and S4.
Figure 6
Figure 6
Cartoon of tug-of-war scenarios in which number of motors control cargo switching at MT-AF intersections. (A) At myosin V:dynein maximum force ratio of 0.5 (1 myosin V per 4 dyneins), the cargo mostly exits on the MT. (B) At a force ratio of 1 (1 myosin V per 2 dyneins), the cargo has an approximately equal chance of stopping at the intersection, exiting on the AF, or exiting on the MT. (C) At a myosin V:dynein force ratio of 4 (2 myosin Vs per dynein), the cargo mostly exits on the AF.

References

    1. Caviston JP, Holzbaur EL. Microtubule motors at the intersection of trafficking and transport. Trends Cell Biol. 2006;16:530–537. - PubMed
    1. Guzik BW, Goldstein LS. Microtubule-dependent transport in neurons: steps towards an understanding of regulation, function and dysfunction. Curr Opin Cell Biol. 2004;16:443–450. - PubMed
    1. Vale RD. The molecular motor toolbox for intracellular transport. Cell. 2003;112:467–480. - PubMed
    1. Krendel M, Mooseker MS. Myosins: tails (and heads) of functional diversity. Physiology (Bethesda) 2005;20:239–251. - PubMed
    1. Kuznetsov SA, Langford GM, Weiss DG. Actin-dependent organelle movement in squid axoplasm. Nature. 1992;356:722–725. - PubMed

Publication types