. 2010 Apr 23;32(4):507-17.
doi: 10.1016/j.immuni.2010.04.004. Epub 2010 Apr 15.

The transcription factor GATA3 actively represses RUNX3 protein-regulated production of interferon-gamma

Affiliations

The transcription factor GATA3 actively represses RUNX3 protein-regulated production of interferon-gamma

Ryoji Yagi et al. Immunity. .

Abstract

The transcription factor GATA3 is crucial for the differentiation of naive CD4(+) T cells into T helper 2 (Th2) cells. Here, we show that deletion of Gata3 allowed the appearance of interferon-gamma (IFN-gamma)-producing cells in the absence of interleukin-12 (IL-12) and IFN-gamma. Such IFN-gamma production was transcription factor T-bet independent. Another T-box-containing transcription factor Eomes, but not T-bet, was induced both in GATA3-deficient CD4(+) T cells differentiated under Th2 cell conditions and in Th2 cells with enforced Runx3 expression, contributing to IFN-gamma production. GATA3 overexpression blocked Runx3-mediated Eomes induction and IFN-gamma production, and GATA3 protein physically interacted with Runx3 protein. Furthermore, we found that Runx3 directly bound to multiple regulatory elements of the Ifng gene and that blocking Runx3 function in either Th1 or GATA3-deficient "Th2" cells results in diminished IFN-gamma production by these cells. Thus, the Runx3-mediated pathway, actively suppressed by GATA3, induces IFN-gamma production in a STAT4- and T-bet-independent manner.


Figures

Figure 1
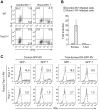
Figure 1. Gata3 Deletion from Naïve CD4+ Cells Results in T-bet-independent IFNγ Production during Th2 Differentiation bothin vitro and in vivo
(A) CD4+ T cells isolated from Gata3fl/fl or Gata3fl/fl-dLck-Cre mice were activated under Th1 or Th2 conditions in the presence of T-depleted splenocytes for 3 days. After cultured with IL-2-containing medium for another 2 days, the cells were re-stimulated with PMA plus ionomycin for 4 hrs. The expression of IL-4, IFNγ and GATA3 were measured by intracellular staining. Numbers indicate the percentage in each quadrant. (B) The amount of IFNγ protein in the supernatants of the cells prepared in (A) that had been re-stimulated with PMA and ionomycin for 24 hrs were measured by ELISA. Error bars represent means ± SD. (C) Naive CD4+ T cells isolated from Tbx21−/− or Gata3fl/fl-dLck-Cre-Tbx21−/− mice were activated under Th1, Th2 or ThNeutral conditions and analyzed as in (A). (D) Nine days after N. brasiliensis infection, CD44highCD62Llow CD4+ T cells were sorted from mesenteric lymph nodes of the infected mice and quantitative RT-PCR was performed. The relative expression of IL-4 and IFNγ was normalized by the expression of glyceraldehyde-3-phosphate dehydrogenase (GAPDH). Error bars represent means ± SD of the data from three individual mice in each group. Data are representative of three independent experiments (A and C).
Figure 2
Figure 2. Increase of Eomes, Runx3 and STAT4 but not T-bet Expression in Gata3fl/fl-dLck-Cre CD4+ T Cells Differentiated under Th2 Conditions
(A) Total RNAs from Gata3fl/fl or Gata3fl/fl-dLck-Cre CD4+ T cells cultured under Th2 conditions were prepared. The expression of indicated genes was measured by quantitative RT-PCR. The relative expression was normalized by the expression of GAPDH and the expression of each gene in WT Th2 cells was set as “1”. Error bars represent means ± SD. (B) Th1 and Th2 cells prepared as in Figure 1A were stained for intracellular Eomes, T-bet, and GATA3 expression. Numbers indicate the percentage in each quadrant. (C) STAT4 and Runx3 protein expression in the cells prepared in (B) was measured by western blotting. Arrow indicates Runx3 protein. Data are representative of three independent experiments.
Figure 3
Figure 3. Eomes but not T-bet Contributes to the IFNγ Production in Gata3fl/fl-dLck-Cre “Th2” Cells
(A) CD4+ T cells isolated from WT or Tbx21−/− mice were stimulated under Th2 conditions and infected with Eomes-GFP-RV (Eomes-RV) or empty GFP-RV as a control (Control-RV). (B) Naive CD4+ T cells isolated WT mice were stimulated under Th2 conditions and infected with Control, Eomes or T-bet-GFP-RV. GFP+CD4+ T cells from each group were sorted and quantitative RT-PCR was performed. The relative expression was normalized by GAPDH and the expression of each gene in Control-RV infected Th2 cells was set as “1”. Error bars represent means ± SD. (C) CD4+ T cells isolated from WT, Gata3fl/fl-dLck-Cre or Gata3fl/fl-dLck-Cre-Tbx21−/− mice were stimulated under Th2 conditions and infected with T-bet-Eomes DN-GFP-RV (a RV containing a dominant negative form of T-bet) or Control-GFP-RV. (A and C) Activated cells were re-stimulated with PMA plus ionomycin and intracellular staining of IFNγ and IL-4 were performed. The plots were gated on CD4+GFP+ cells. Numbers indicate the percent of cells in each quadrant or gate. Data are representative of two independent experiments.
Figure 4
Figure 4. Runx3 Induces IFNγ Production and Eomes expression
(A) CD4+ T cells isolated from WT and Tbx21−/− mice were stimulated under Th2 conditions and infected with Runx3-GFP-RV or Control-GFP-RV. Infected cells were re-stimulated and stained as in Figure 3A. The dot plots were gated on CD4+GFP+ cells. (B) CD4+GFP+ cells were isolated by cell sorting from the cells prepared in (A). RNAs were prepared from sorted cells and the expression of Eomes and T-bet was measured by quantitative RT-PCR. The expression levels of each gene in Control-RV infected cells were set as “1”. (C) CD4+ T cells isolated from WT mice were stimulated under Th2 conditions and then co-infected with Runx3-Thy1.1-RV and T-bet-Eomes DN-GFP-RV or Control-GFP-RV. Infected cells were re-stimulated and stained as in Figure 3A. Numbers indicate the percent of cells in each quadrant or gate. Error bars represent means ± SD. Data are representative of two (B) or three (A and C) independent experiments.
Figure 5
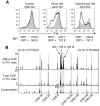
Figure 5. Runx3 is Important for Optimal IFNγ Production by Th1 cells and It Binds to Many Regulatory Elements Located in Ifng Locus
(A) WT CD4+ T cells were stimulated under Th1 conditions and infected with Runx3 DN-GFP-RV, T-bet-Eomes DN-GFP-RV or Control-GFP-RV. Infected cells were re-stimulated and stained as in Figure 3A. The black lines represent CD4+GFP+ cells and the shaded area represents CD4+GFP- cells in the same culture. (B) WT Th1 cells were harvested and fixed. ChIPSeq analysis was performed using specific antibody against CBFβ or T-bet. The sequence tags mapped to the locus of Ifng are shown. Critical Runx and T-bet binding elements corresponding to DNase I hypersensitivity (HS) sites and conserved non-coding sequences (CNS) are highlighted.
Figure 6
Figure 6. GATA3 Represses Runx3-Mediated IFNγ Production and Eomes Induction
(A and B) WT CD4+ T cells were stimulated under Th2 conditions and co-infected with GATA3-GFP-RV and Runx3-Thy1.1-RV. Infected cells were re-stimulated and stained as in Figure 3A. The dot plots were gated based on the expression of GFP and Thy1.1 (A). Nine subsets (1 through 9) expressing different amount of GFP and Thy1.1 were selected for further analysis (B, left panel). The percentages of IL-4 or IFNγ-producing cells from these 9 subsets were plotted (B, right panel). (C) WT CD4+ T cells were stimulated and infected as in (A). Infected cells were sorted based on the expression of GFP and Thy1.1. RNAs were prepared from sorted cells and the expression of Eomes was measured by quantitative RT-PCR. The relative expression of Eomes in Control-Thy1.1+ and Control-GFP+ cells was set as “1”. Error bars represent means ± SD. Data are representative of three (A and B) and two (C) independent experiments.
Figure 7
Figure 7. Runx3 Protein Interacts with GATA3 Protein and Runx3 is Responsible for IFNγ Production in GATA3-deficient “Th2” Cells
(A) Total Th1 cell lysates were immunoprecipitated with anti-GATA3 or isotype antibody and then immune-blotted with anti-Runx polyclonal Ab. The membrane was then stripped and re-blotted with GATA3 mAb. The cell lysates passed the IP columns were also blotted with anti-Runx as a loading control. (B) Runx3-RV and Myc-tagged WT or mutant GATA3-RV were co-transfected into HEK 293T cells as indicated. Total cell lysates or anti-GATA3-immunoprecipitated cell lysates were blotted with anti-Runx polyclonal Ab or anti-Myc. (C) WT CD4+ T cells were stimulated under Th2 conditions and co-infected with Runx3-GFP-RV and WT or mutant GATA3-Thy1.1-RV. Infected cells were re-stimulated and stained as in Figure 3A. The percentage of IFNγ-producing cells in each group was plotted. (D) CD4+ T cells isolated from WT, Gata3fl/fl-dLck-Cre-Tbx21−/− or Gata3fl/flRunx3fl/fl dLck-Cre-Tbx21−/− mice were activated under Th2 conditions as shown in Figure 1A. They were then stained for intracellular IL-4, IFNγ and Eomes expression. Numbers indicate the percentage in each quadrant. Data are representative of two independent experiments.

Comment in

References

    1. Afkarian M, Sedy JR, Yang J, Jacobson NG, Cereb N, Yang SY, Murphy TL, Murphy KM. T-bet is a STAT1-induced regulator of IL-12R expression in naive CD4+ T cells. Nature immunology. 2002;3:549–557. - PubMed
    1. Ansel KM, Djuretic I, Tanasa B, Rao A. Regulation of Th2 differentiation and Il4 locus accessibility. Annu Rev Immunol. 2006;24:607–656. - PubMed
    1. Barski A, Cuddapah S, Cui K, Roh TY, Schones DE, Wang Z, Wei G, Chepelev I, Zhao K. High-resolution profiling of histone methylations in the human genome. Cell. 2007;129:823–837. - PubMed
    1. Bosselut R. CD4/CD8-lineage differentiation in the thymus: from nuclear effectors to membrane signals. Nat Rev Immunol. 2004;4:529–540. - PubMed
    1. Cote-Sierra J, Foucras G, Guo L, Chiodetti L, Young HA, Hu-Li J, Zhu J, Paul WE. Interleukin 2 plays a central role in Th2 differentiation. Proc Natl Acad Sci U S A. 2004;101:3880–3885. - PMC - PubMed

Publication types

MeSH terms